The subtopic in the middle and 13 tasks round it: label three diagrams, complete two tables, put a process in order and fill 65 gaps. Every box is standard level. Type into the blanks and check them, or print it on A4, Letter or A3 with an answer key.
Paper
Each subtopic on a landscape page, as shuffled and chosen on screen.
C4.1
Populations and communities
1 of 2Ecosystems · Interaction and interdependence
Hover over a box to see it. Untick it to leave it off this sheet and its printout.
Name
C4.1.1, C4.1.10Who lives together
A population is a group of organisms of one living in the same area that normally . Separate populations are told apart by : members of one do not normally breed with members of another. All the interacting populations in an area, plants, animals, fungi and bacteria alike, make up a .
C4.1.5, C4.1.7, C4.1.8Growing to a limit
1234
1
2
3
4
At first are plentiful and there are few predators or diseases, so numbers double again and again at a steady rate. Plotted on a scale against time, this early growth gives a . The S-shaped curve is an idealized : test it by counting yeast cells or duckweed fronds as they multiply.
C4.1.5, C4.1.6Crowding pushes back
The is the largest population an environment can support for a long time, set by limited resources such as food, water, nest sites or, for plants, light. As a population grows denser, competition for these, the risk of and the spread of pathogens all increase. These factors push numbers back towards the limit: . A flood or a hard frost kills a share whatever the density: a factor.
C4.1.4Mark and recapture
Number the steps in order.
Mark each one in a way that does not harm it or make it easier for predators to spot.
Catch a second sample: count all of them (N) and the marked ones among them (R).
Catch a sample of the animals in the area and count them (M).
Release them where they were caught.
Wait long enough for them to mix back into the population.
Quadrats will not do for animals. Population size = M × N ÷ R (the Lincoln index): if 30 are marked and 6 of the 40 caught later carry a mark, the estimate is . It assumes no births, deaths or between the samples, and no lost marks.
C4.1Populations and communities
C4.1.9Rivals and allies
Members of one species need the same resources, so when these run short they compete: competition. Robins defend feeding , and crowded seedlings shade each other out. Yet many cooperate: wolves hunt in packs to bring down prey bigger than themselves, emperor penguins through the Antarctic winter to save heat, and meerkats take turns as .
C4.1.2, C4.1.3Square by square
Counting every individual is rarely practical, so population size is estimated from samples, chosen so that every part of the area has an equal chance of being picked. The estimate always differs a little from the true size: the . For organisms, such as barnacles or buttercups, place quadrats at coordinates, count the individuals in each and scale the mean up to the whole area. The of the mean count shows how much counts vary between quadrats, and so how evenly the population is spread.
C4.1.11Between species
Relationship
Example
a caterpillar eating oak leaves
an owl catching and eating a vole
a tick living on its deer , feeding on its blood
the cholera bacterium invading the human gut and causing disease
2 of 2Ecosystems · Interaction and interdependenceName
C4.1.12Three partnerships
123
1
2
3
In each pair both species gain: . The legume gets fixed ; the orchid gets and, as a seedling, sugars; the coral gets sugars made by . In return each partner gets sugars, shelter or CO₂.
C4.1.13A newcomer takes over
Grey squirrels, brought to Britain from North America in the 1870s, digest acorns better than red squirrels, which had lived there since the end of the last Ice Age. In oak woods the greys gather more of the autumn food, so the reds lose out. This in gaining is what makes an introduced species : it spreads at the expense of the species.
C4.1.14, C4.1.15Found together?
B present
B absent
Total
A present
4 (expected )
16 (expected )
20
A absent
21 (expected )
9 (expected )
30
Total
25
25
50
Two plant species, A and B, in 50 random quadrats. Expected = row total × column total ÷ 50. χ² = , with degree of freedom; that is above the critical value of 3.84 (p = 0.05), so the two occur together less often than chance predicts. Field like these suggest competition but cannot prove it; a laboratory experiment, or a field that takes one species away, can test it.
C4.1Populations and communities
C4.1.18Chemical weapons
Black walnut trees release juglone into the soil, which stops many other plants germinating or growing nearby: this is . The soil fungus Penicillium secretes penicillin, an that kills nearby . In both, a chemical released into the environment deters .
C4.1.16, C4.1.17Hares and lynx
Fur-trading records from Canada show snowshoe hares and lynx rising and falling in a cycle about years long. Lynx numbers peak a little the hares: more prey feeds more predators, which then cut the prey back. Control by predators from the level above is control; a limit set by food from the level below is control. Both act, but one is usually dominant.
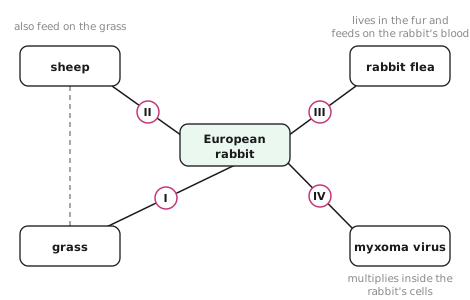
C4.1 examSome of the organisms that interact with European rabbits
1234
1
2
3
4
Word bank1101215afterallelopathyantibioticbacteriabottom-upcompetitioncompetitive advantagecompetitorsendemicfungal hyphaeherbivoryinvasivemanipulationmineralsmutualismnitrogenobservationsparasitismpathogenicityphotosynthesisresourcesroot noduletop-downzooxanthellae
Answer key
Every box on the sheet with its gaps filled in, as the subtopic reads in full.
GapsWho lives together
A population is a group of organisms of one species living in the same area that normally interbreed. Separate populations are told apart by reproductive isolation: members of one do not normally breed with members of another. All the interacting populations in an area, plants, animals, fungi and bacteria alike, make up a community.
GapsSquare by square
Counting every individual is rarely practical, so population size is estimated from samples, chosen so that every part of the area has an equal chance of being picked. The estimate always differs a little from the true size: the sampling error. For sessile organisms, such as barnacles or buttercups, place quadrats at random coordinates, count the individuals in each and scale the mean up to the whole area. The standard deviation of the mean count shows how much counts vary between quadrats, and so how evenly the population is spread.
OrderMark and recapture
Catch a sample of the animals in the area and count them (M).
Mark each one in a way that does not harm it or make it easier for predators to spot.
Release them where they were caught.
Wait long enough for them to mix back into the population.
Catch a second sample: count all of them (N) and the marked ones among them (R).
Quadrats will not do for motile animals. Population size = M × N ÷ R (the Lincoln index): if 30 are marked and 6 of the 40 caught later carry a mark, the estimate is 200. It assumes no births, deaths or migration between the samples, and no lost marks.
LabelGrowing to a limit
exponential phase
transitional phase
plateau phase
carrying capacity
At first resources are plentiful and there are few predators or diseases, so numbers double again and again at a steady rate. Plotted on a logarithmic scale against time, this early growth gives a straight line. The S-shaped curve is an idealized model: test it by counting yeast cells or duckweed fronds as they multiply.
GapsCrowding pushes back
The carrying capacity is the largest population an environment can support for a long time, set by limited resources such as food, water, nest sites or, for plants, light. As a population grows denser, competition for these, the risk of predation and the spread of pathogens all increase. These density-dependent factors push numbers back towards the limit: negative feedback. A flood or a hard frost kills a share whatever the density: a density-independent factor.
GapsRivals and allies
Members of one species need the same resources, so when these run short they compete: intraspecific competition. Robins defend feeding territories, and crowded seedlings shade each other out. Yet many cooperate: wolves hunt in packs to bring down prey bigger than themselves, emperor penguins huddle through the Antarctic winter to save heat, and meerkats take turns as sentries.
TableBetween species
Relationship
Example
Herbivory
a caterpillar eating oak leaves
Predation
an owl catching and eating a vole
Parasitism
a tick living on its deer host, feeding on its blood
Pathogenicity
the cholera bacterium invading the human gut and causing disease
Interspecific competition
lions and hyenas hunting the same scarce prey
LabelThree partnerships
root nodule
fungal hyphae
zooxanthellae
In each pair both species gain: mutualism. The legume gets fixed nitrogen; the orchid gets minerals and, as a seedling, sugars; the coral gets sugars made by photosynthesis. In return each partner gets sugars, shelter or CO₂.
GapsA newcomer takes over
Grey squirrels, brought to Britain from North America in the 1870s, digest acorns better than red squirrels, which had lived there since the end of the last Ice Age. In oak woods the greys gather more of the autumn food, so the reds lose out. This competitive advantage in gaining resources is what makes an introduced species invasive: it spreads at the expense of the endemic species.
TableFound together?
B present
B absent
Total
A present
4 (expected 10)
16 (expected 10)
20
A absent
21 (expected 15)
9 (expected 15)
30
Total
25
25
50
Two plant species, A and B, in 50 random quadrats. Expected = row total × column total ÷ 50. χ² = 12, with 1 degree of freedom; that is above the critical value of 3.84 (p = 0.05), so the two occur together less often than chance predicts. Field observations like these suggest competition but cannot prove it; a laboratory experiment, or a field manipulation that takes one species away, can test it.
GapsHares and lynx
Fur-trading records from Canada show snowshoe hares and lynx rising and falling in a cycle about 10 years long. Lynx numbers peak a little after the hares: more prey feeds more predators, which then cut the prey back. Control by predators from the level above is top-down control; a limit set by food from the level below is bottom-up control. Both act, but one is usually dominant.
GapsChemical weapons
Black walnut trees release juglone into the soil, which stops many other plants germinating or growing nearby: this is allelopathy. The soil fungus Penicillium secretes penicillin, an antibiotic that kills nearby bacteria. In both, a chemical released into the environment deters competitors.
Exam diagramSome of the organisms that interact with European rabbits
 Biology by Bradford
 1234
1234