 Biology by Bradford
Example A · 17 · Example B · 14 vs 13 · Example C · 13
Example B · a real HL script, names removed
The annotated script.
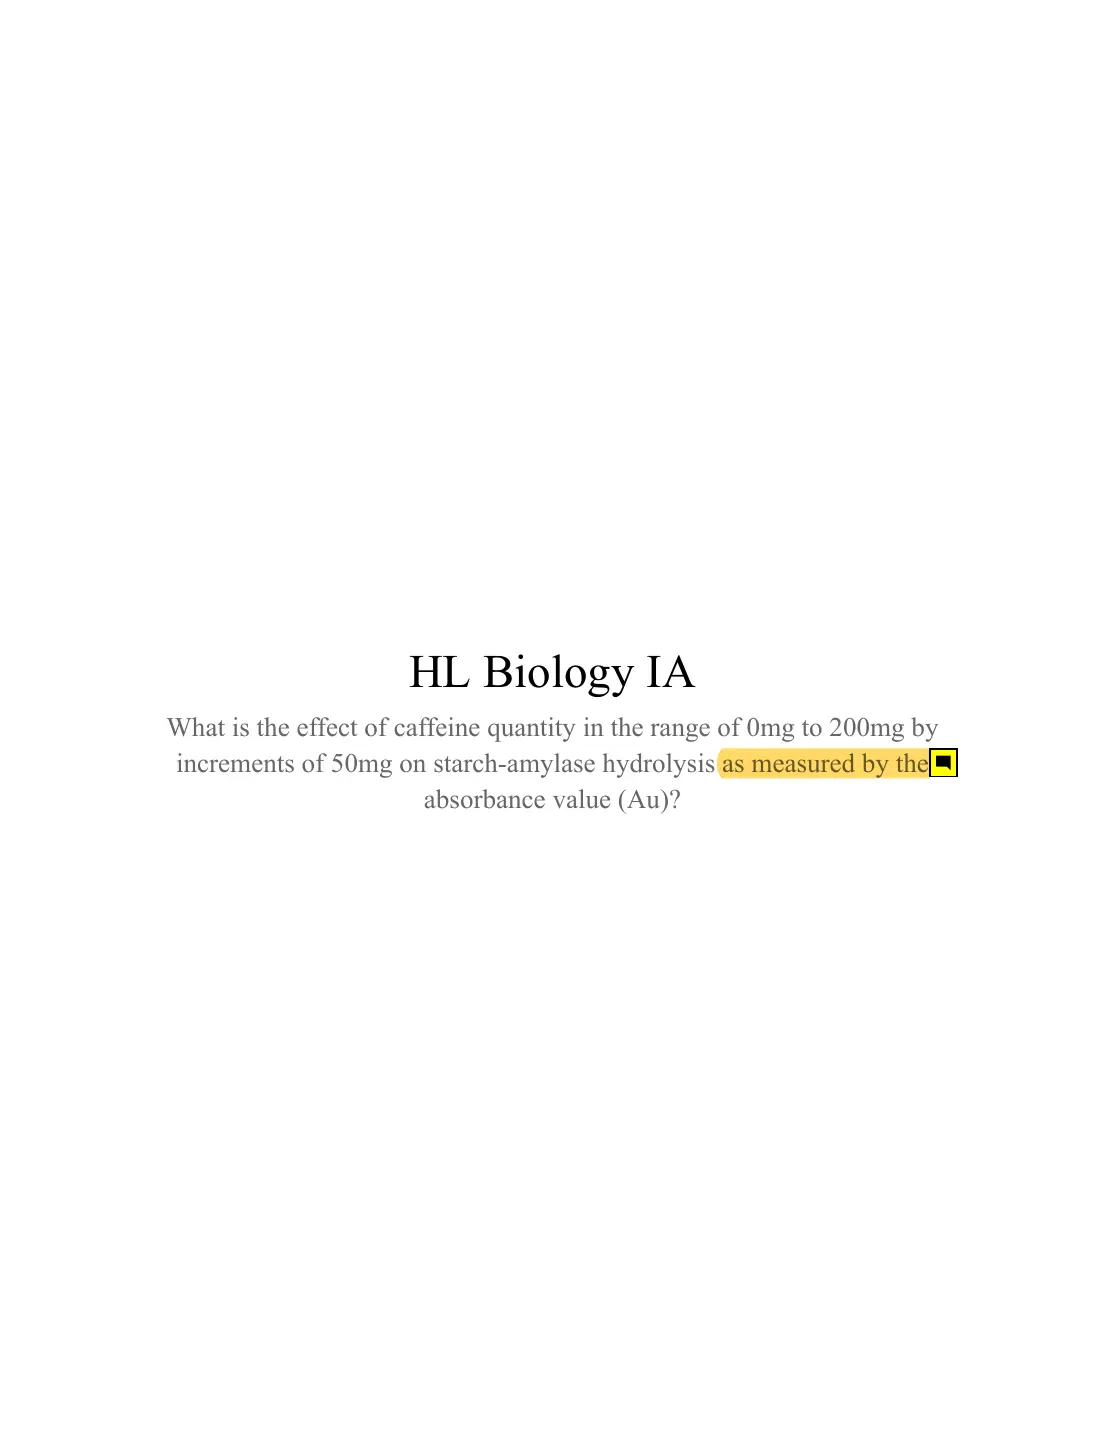
Caffeine and amylase (HL)“What is the effect of caffeine quantity in the range of 0 mg to 200 mg by increments of 50 mg on starch-amylase hydrolysis as measured by the absorbance value (Au)?”
- Mark14/24RD 4 · DA 5 · C 3 · E 2 from the teacher
- Second markerGives 13: the normal spread between two careful markers.
- Notes20 comments, pinned where the evidence is.
- HowTap a number on a page to read its note, or a note to find it on the page.
Page 1 of 16
- Research design · first strand
The range and increments of the independent variable are given. The source of the amylase and the wavelength are not.
Page 2 of 16
- Research design · first strand
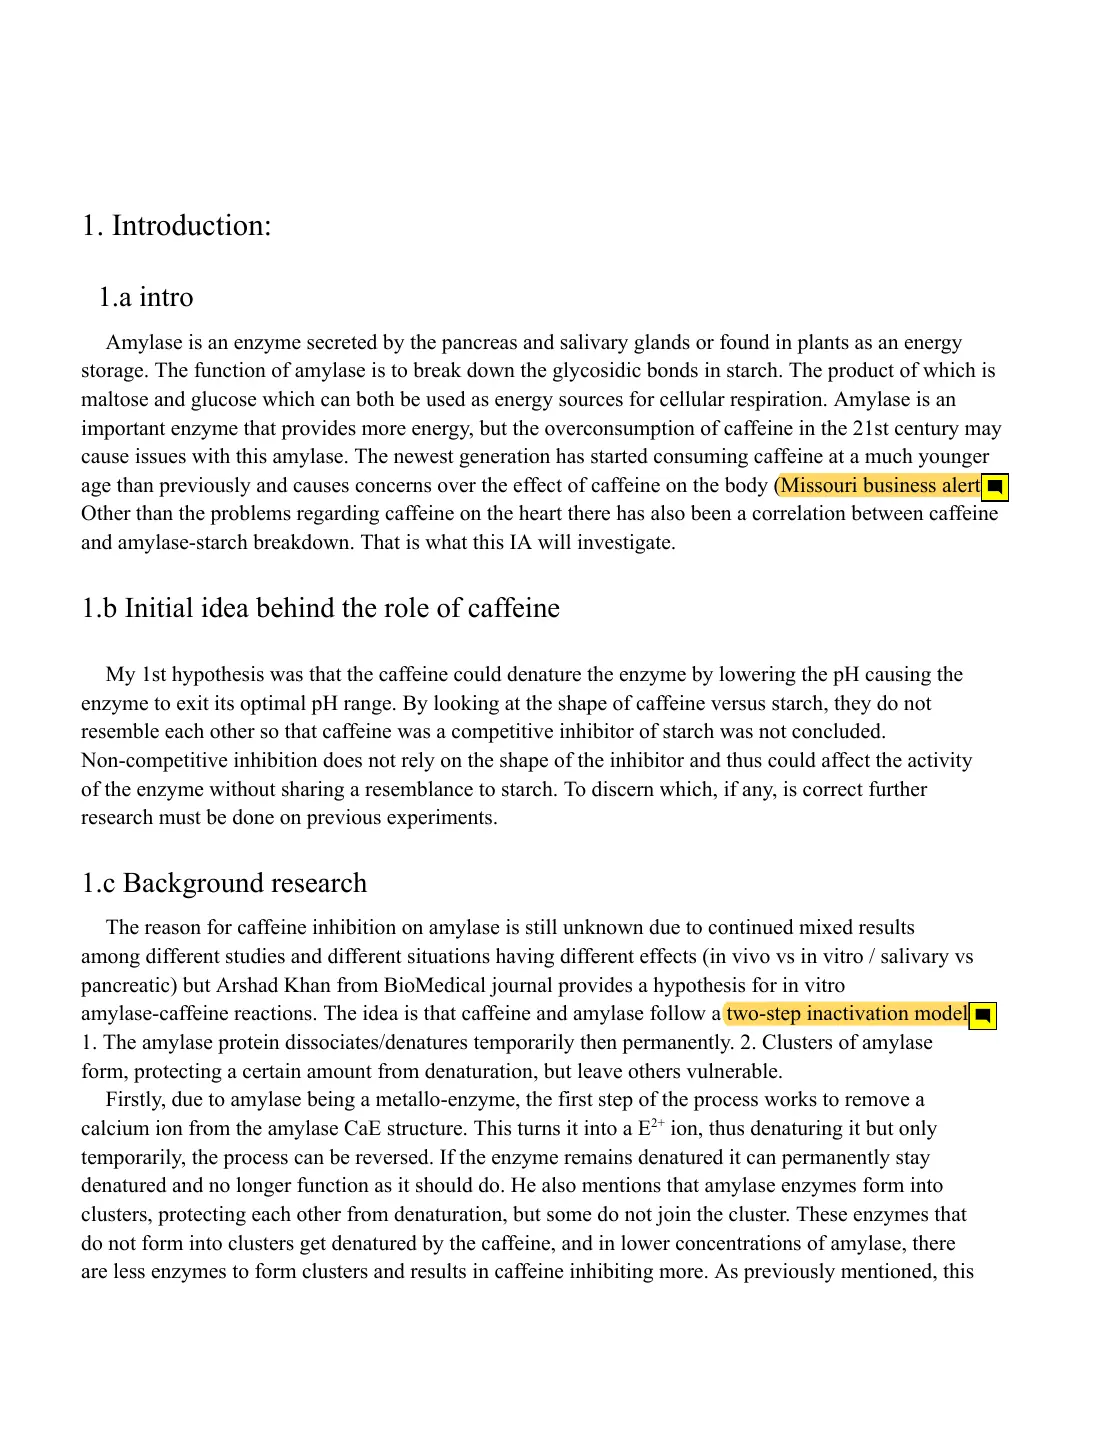
This source does not appear in the works cited.
- Research design · first strand
Relevant mechanism from a published source, explained in some detail.
Page 3 of 16
- Research design · second strand
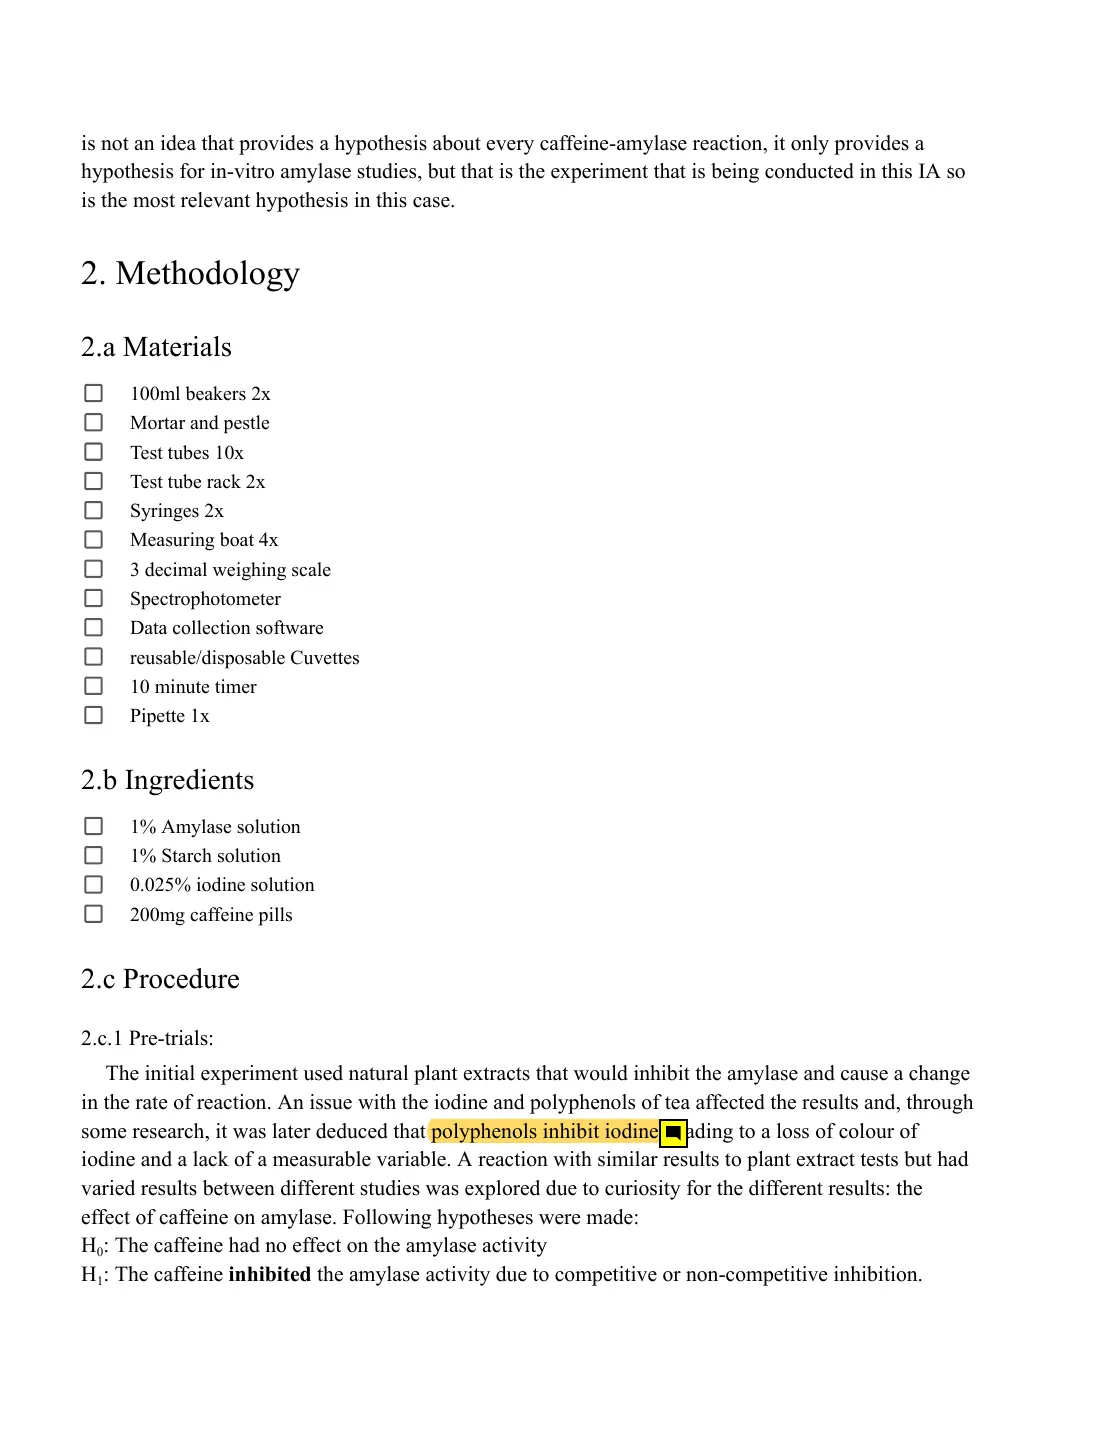
The pilot with plant extracts is described and the reason for abandoning it is given. A positive point.
Page 4 of 16
- Research design · second strand
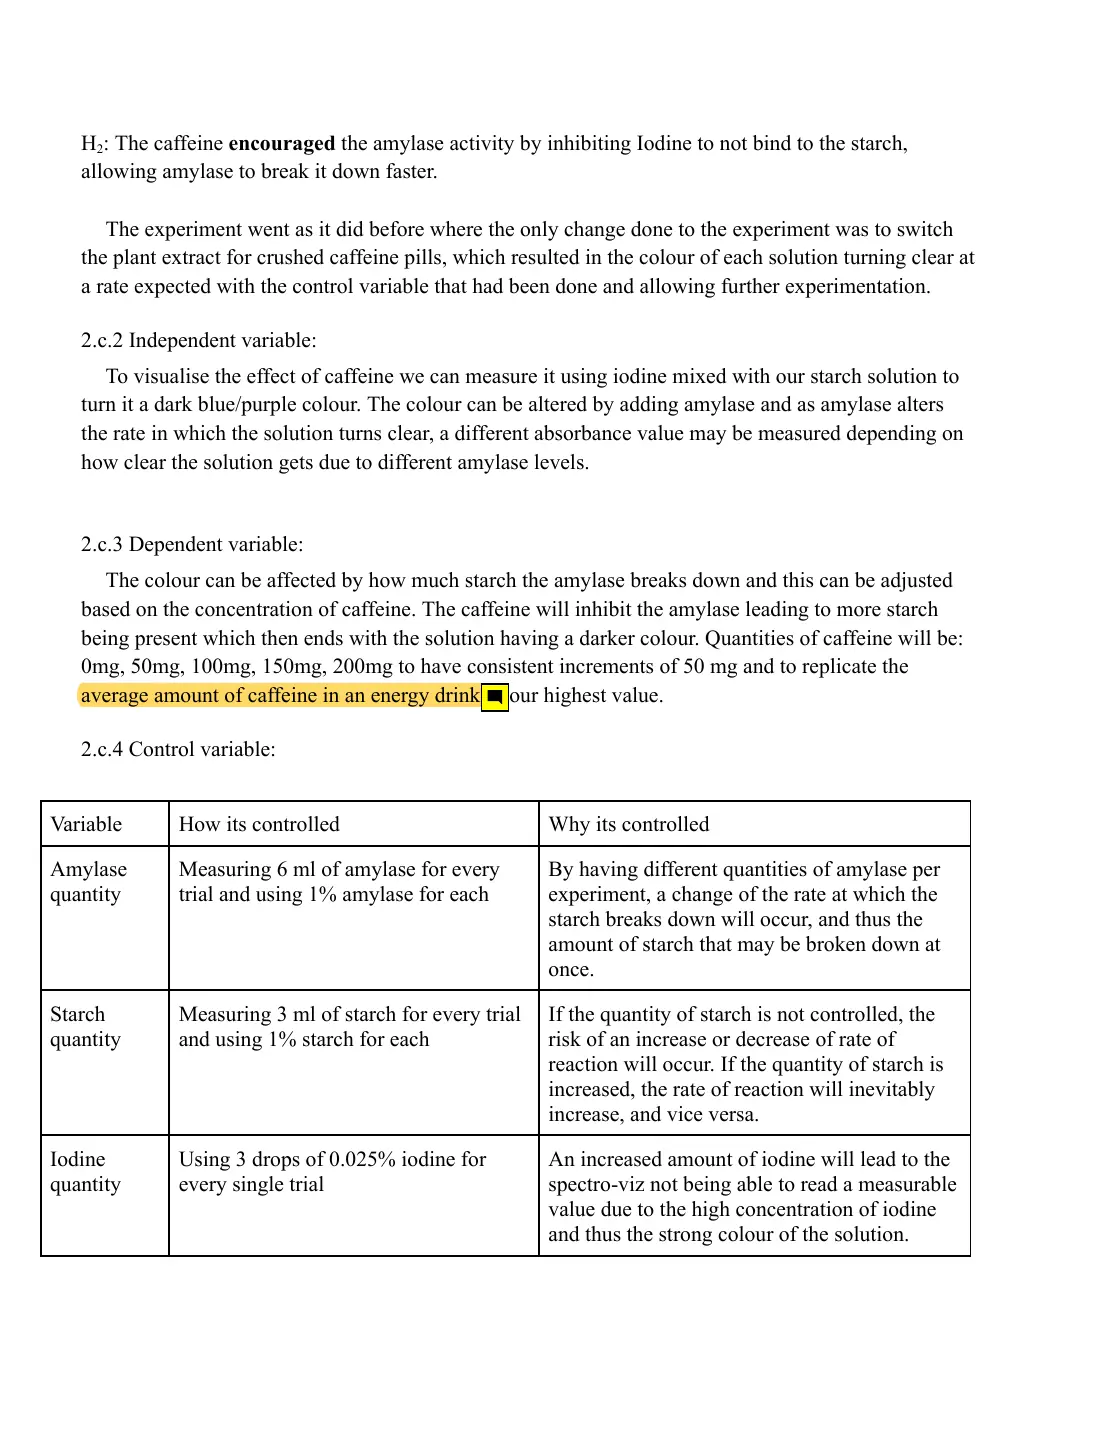
Some justification for the upper limit of the range.
Page 5 of 16
- Research design · third strand
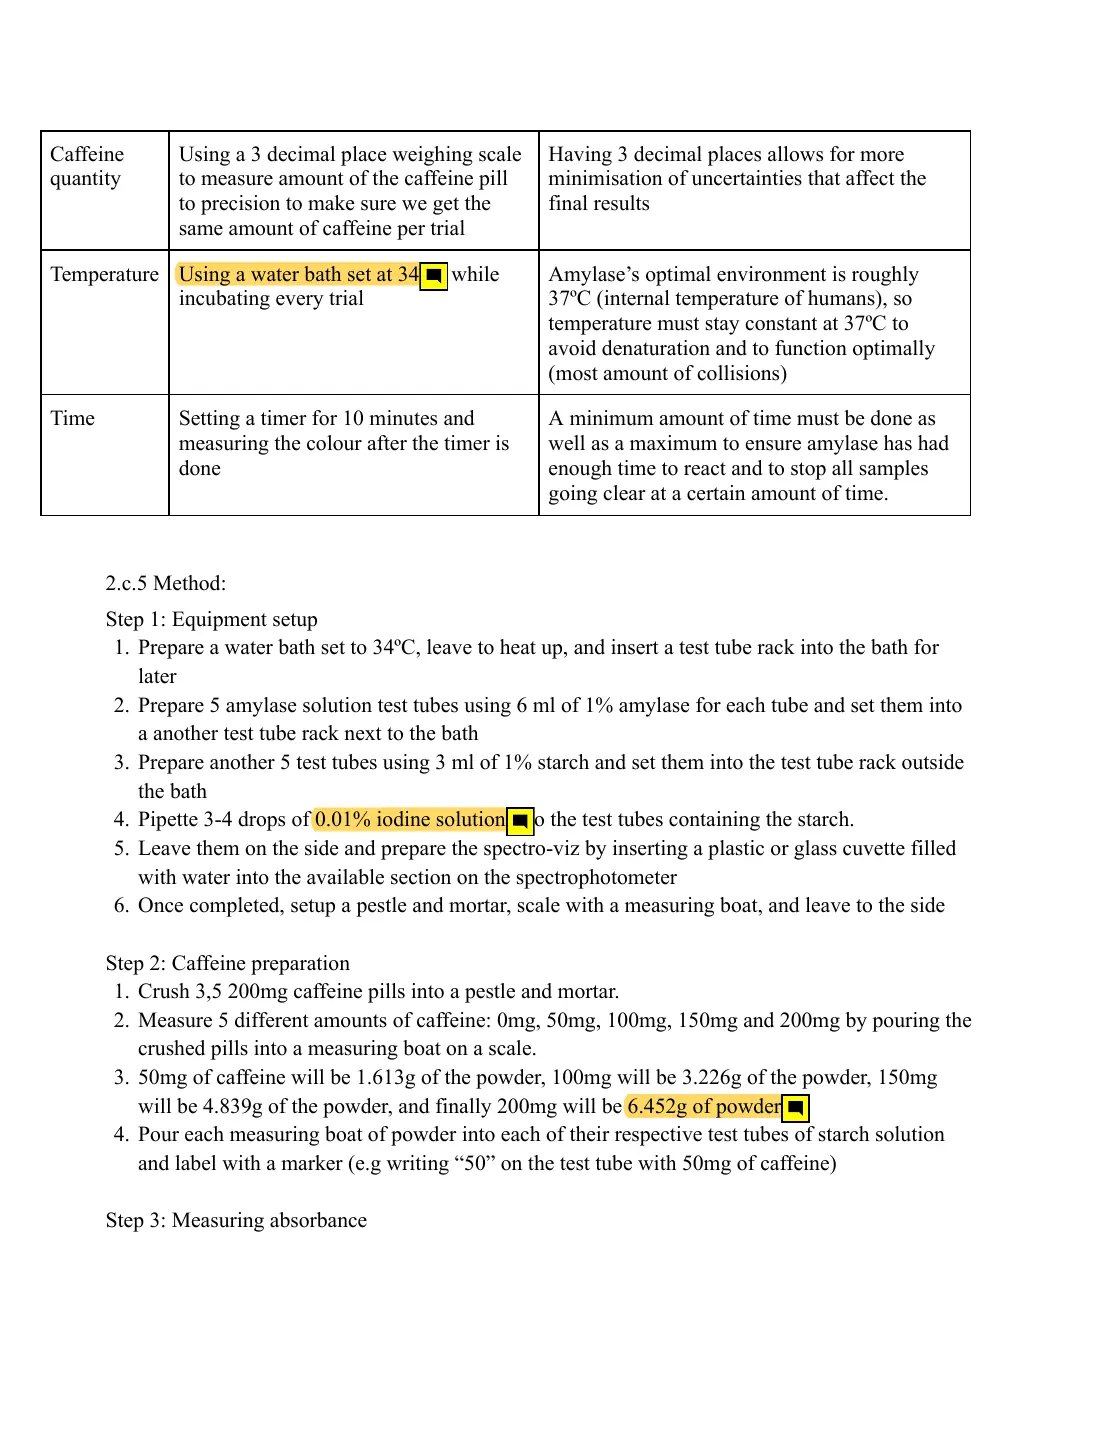
The bath is set at 34 °C but the justification refers to 37 °C.
- Research design · third strand
The materials list 0.025% iodine and 3 drops. Which was used?
- Research design · second strand
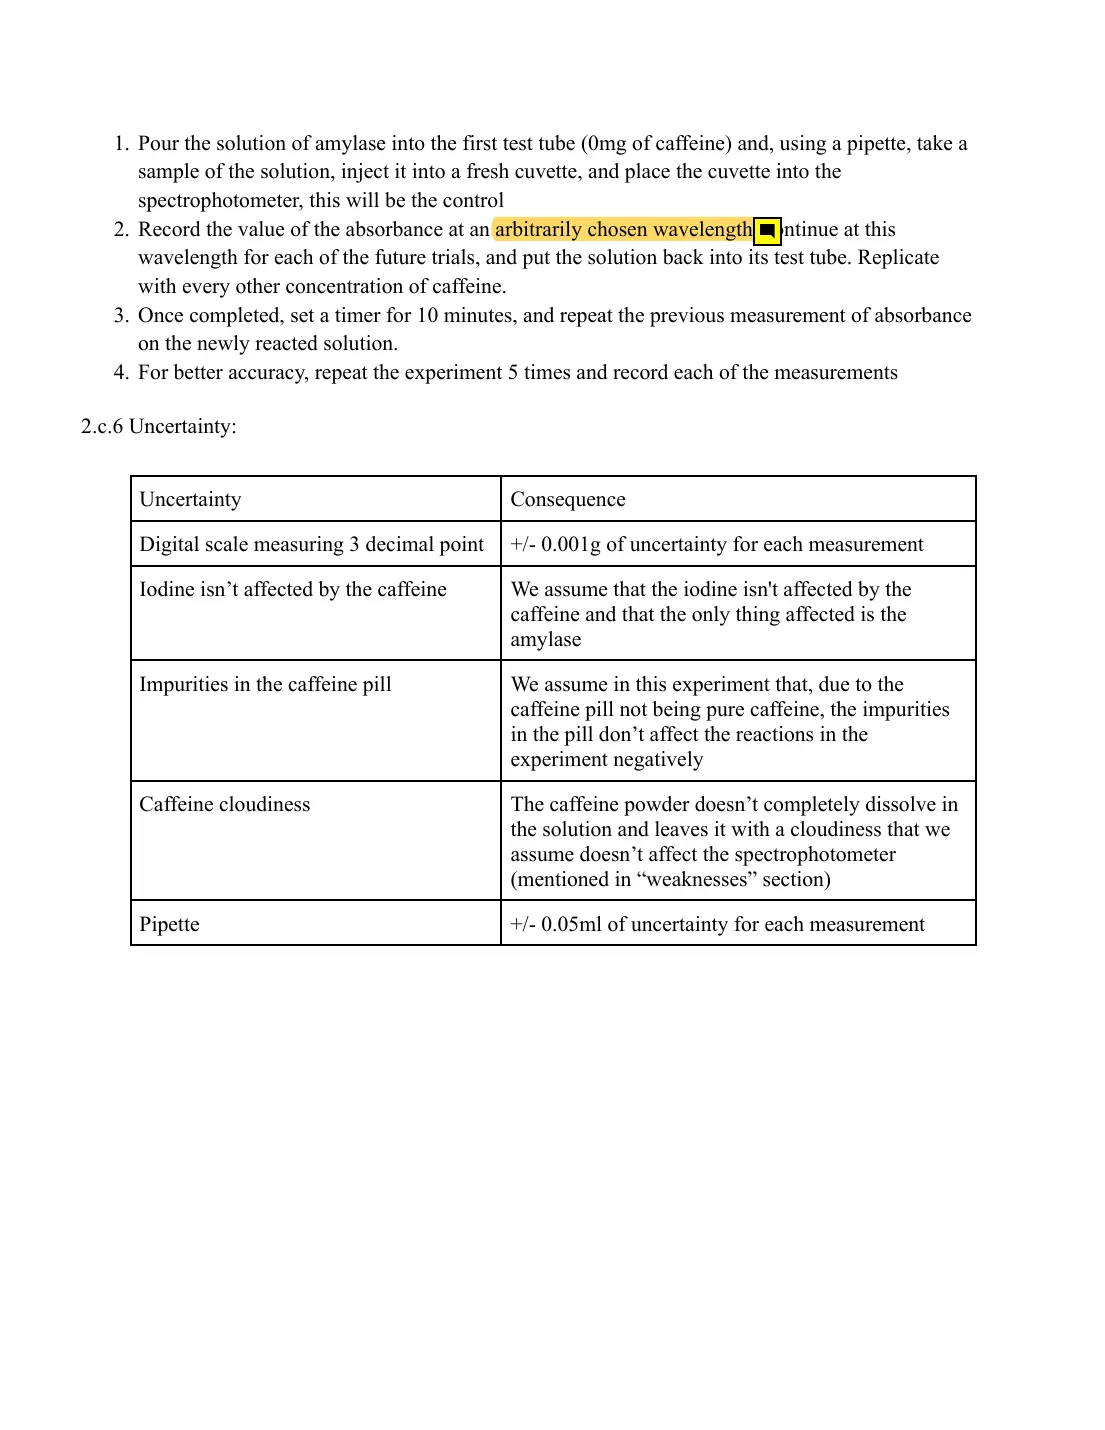
Over 6 g of tablet powder in 3 ml of starch solution. Most of the tablet is filler, and no control for the filler is included.
Page 6 of 16
- Research design · second strand
The choice of wavelength is not justified (about 599 nm is stated later).
Page 7 of 16
Page 8 of 16
- Data analysis · first strand
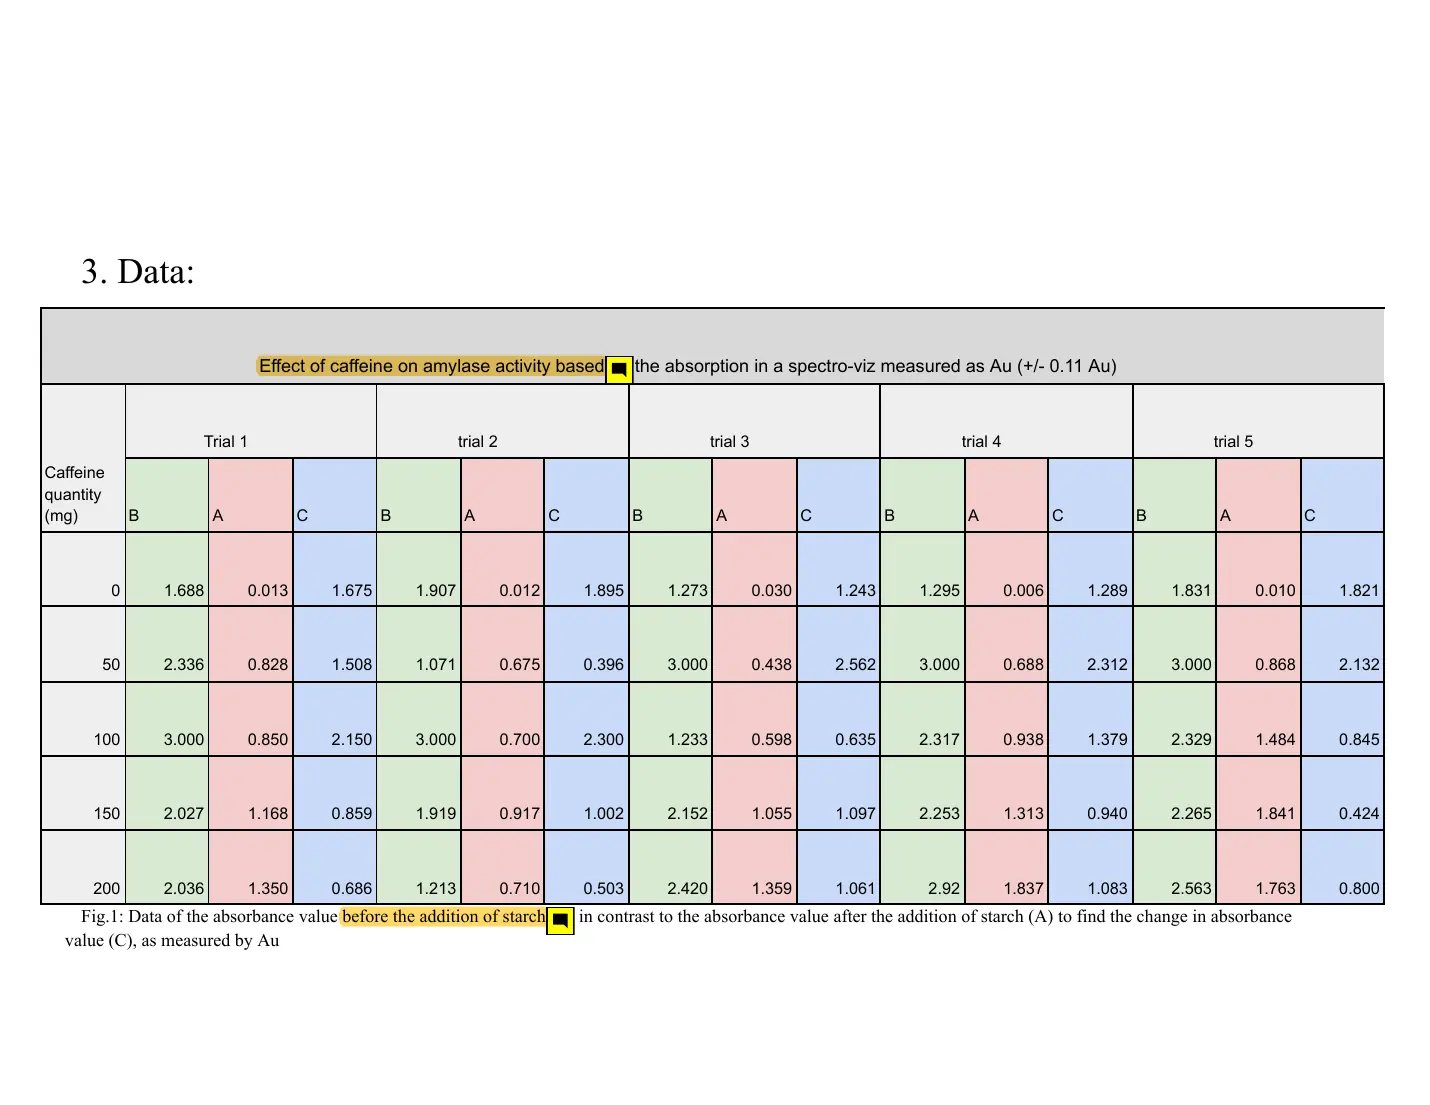
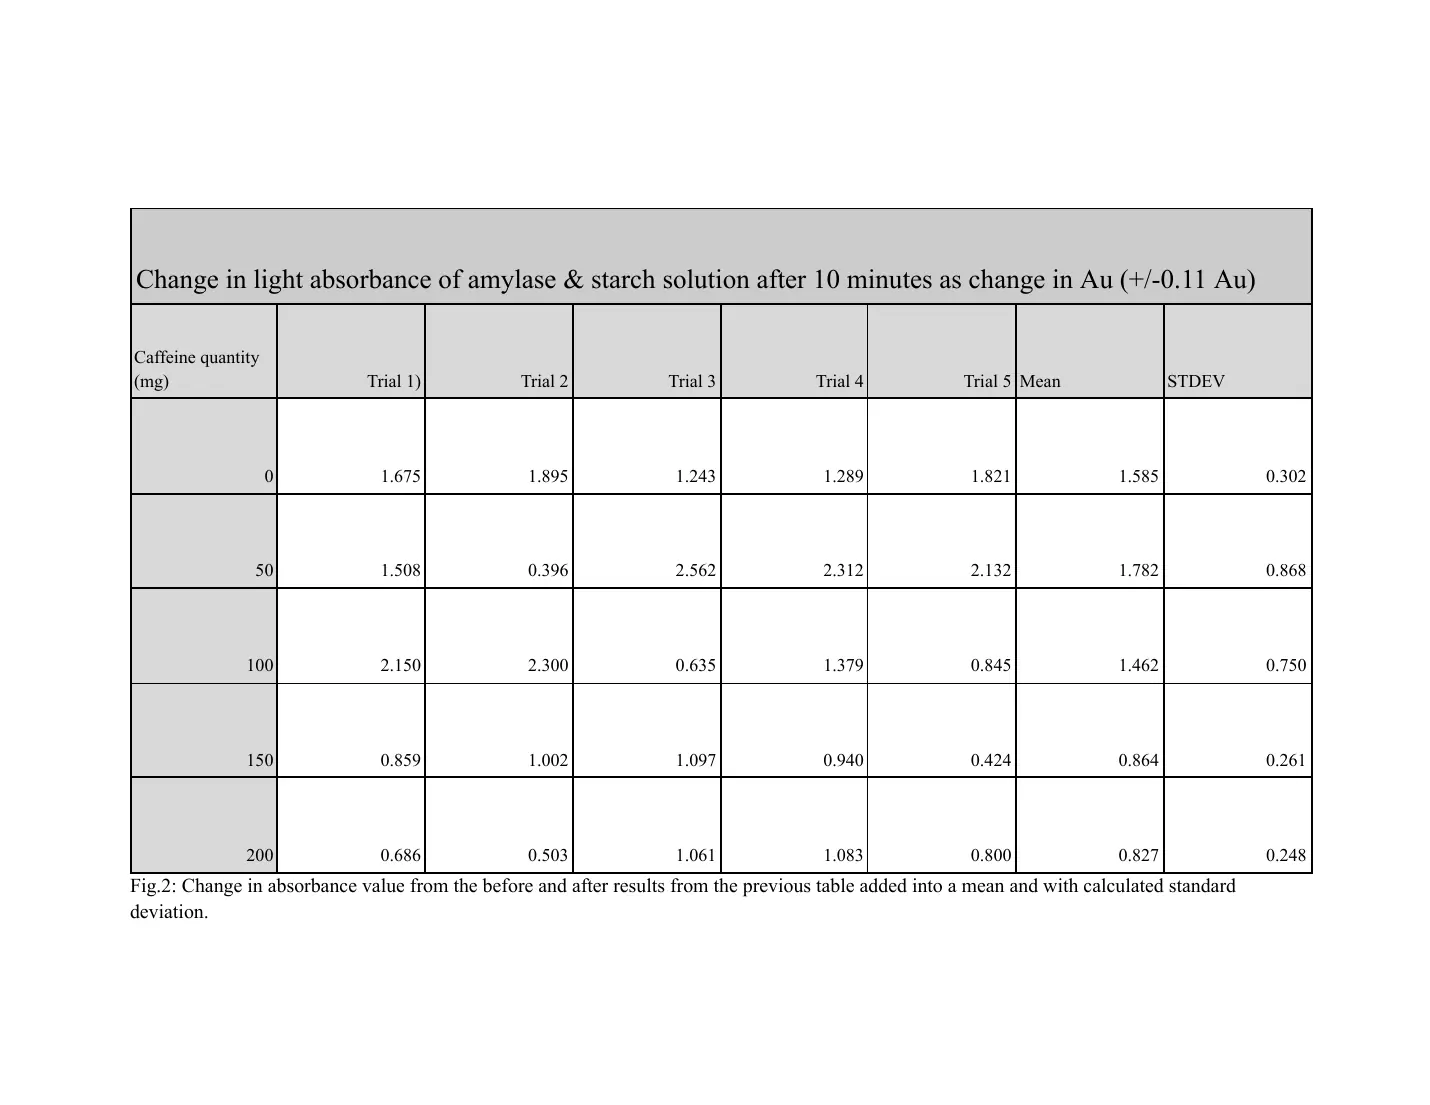
3.000 appears to be the upper limit of the instrument. Several before readings are off scale, so the changes calculated from them are underestimates.
- Data analysis · first strand
The caption does not match the method, where B is read before the 10 minute incubation.
Page 9 of 16
Page 10 of 16
- Data analysis · first strand
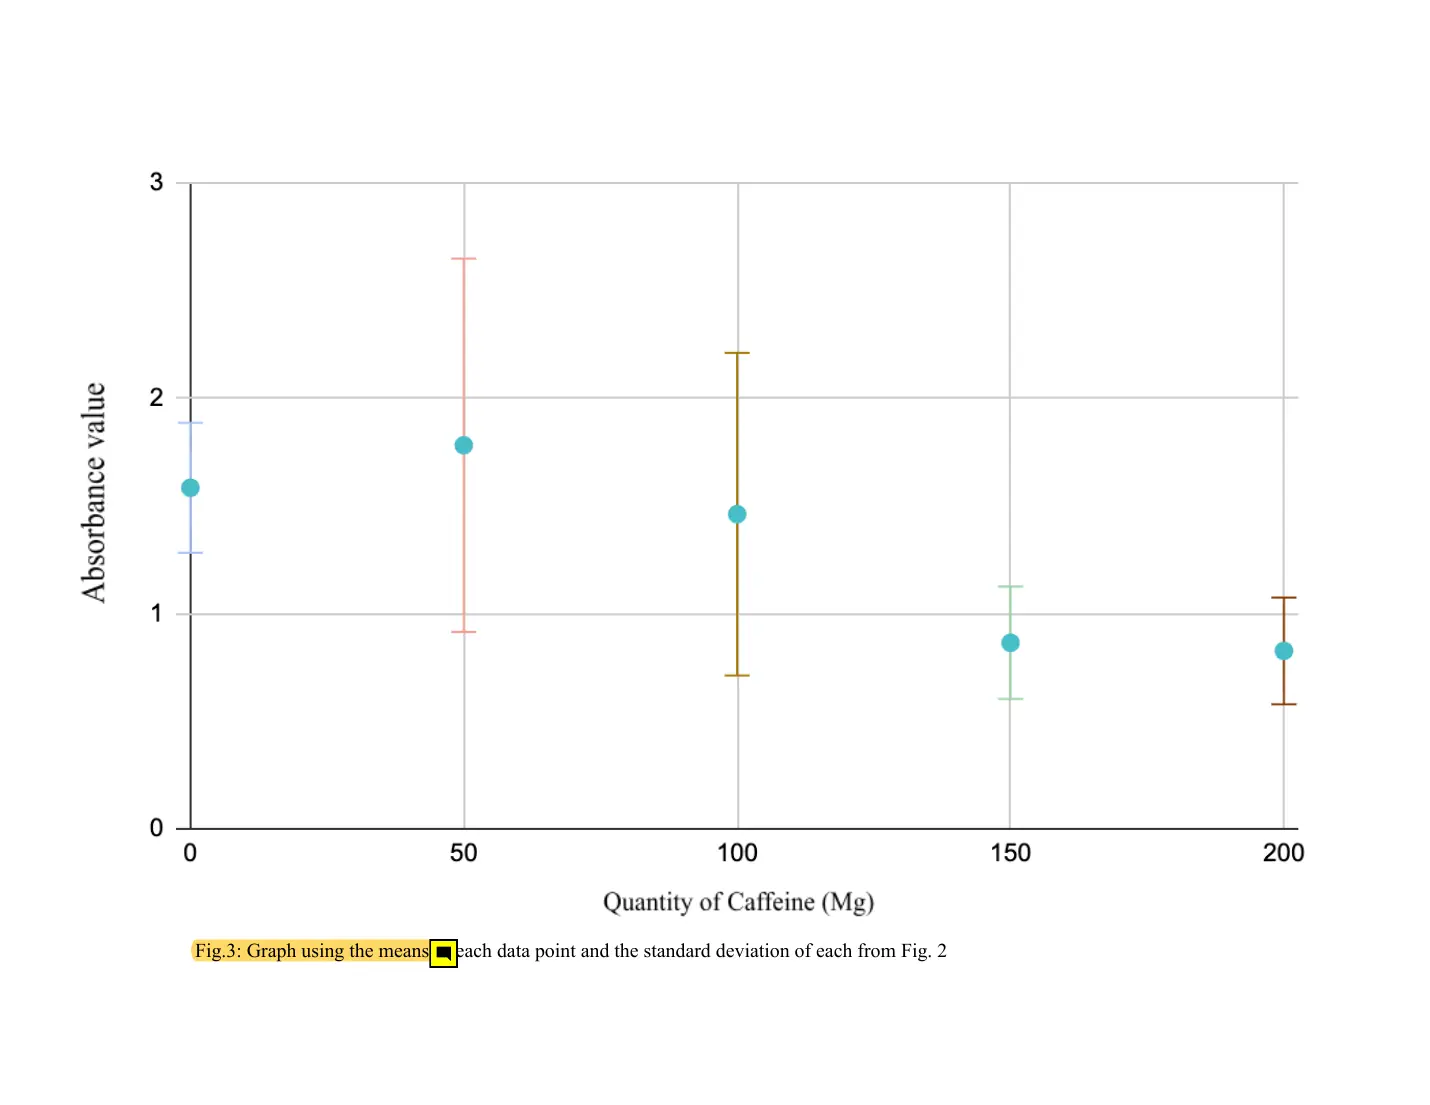
Appropriate graph with SD bars identified. The y-axis shows change in absorbance, not absorbance, and the unit is missing.
Page 11 of 16
Page 12 of 16
- Data analysis · third strand
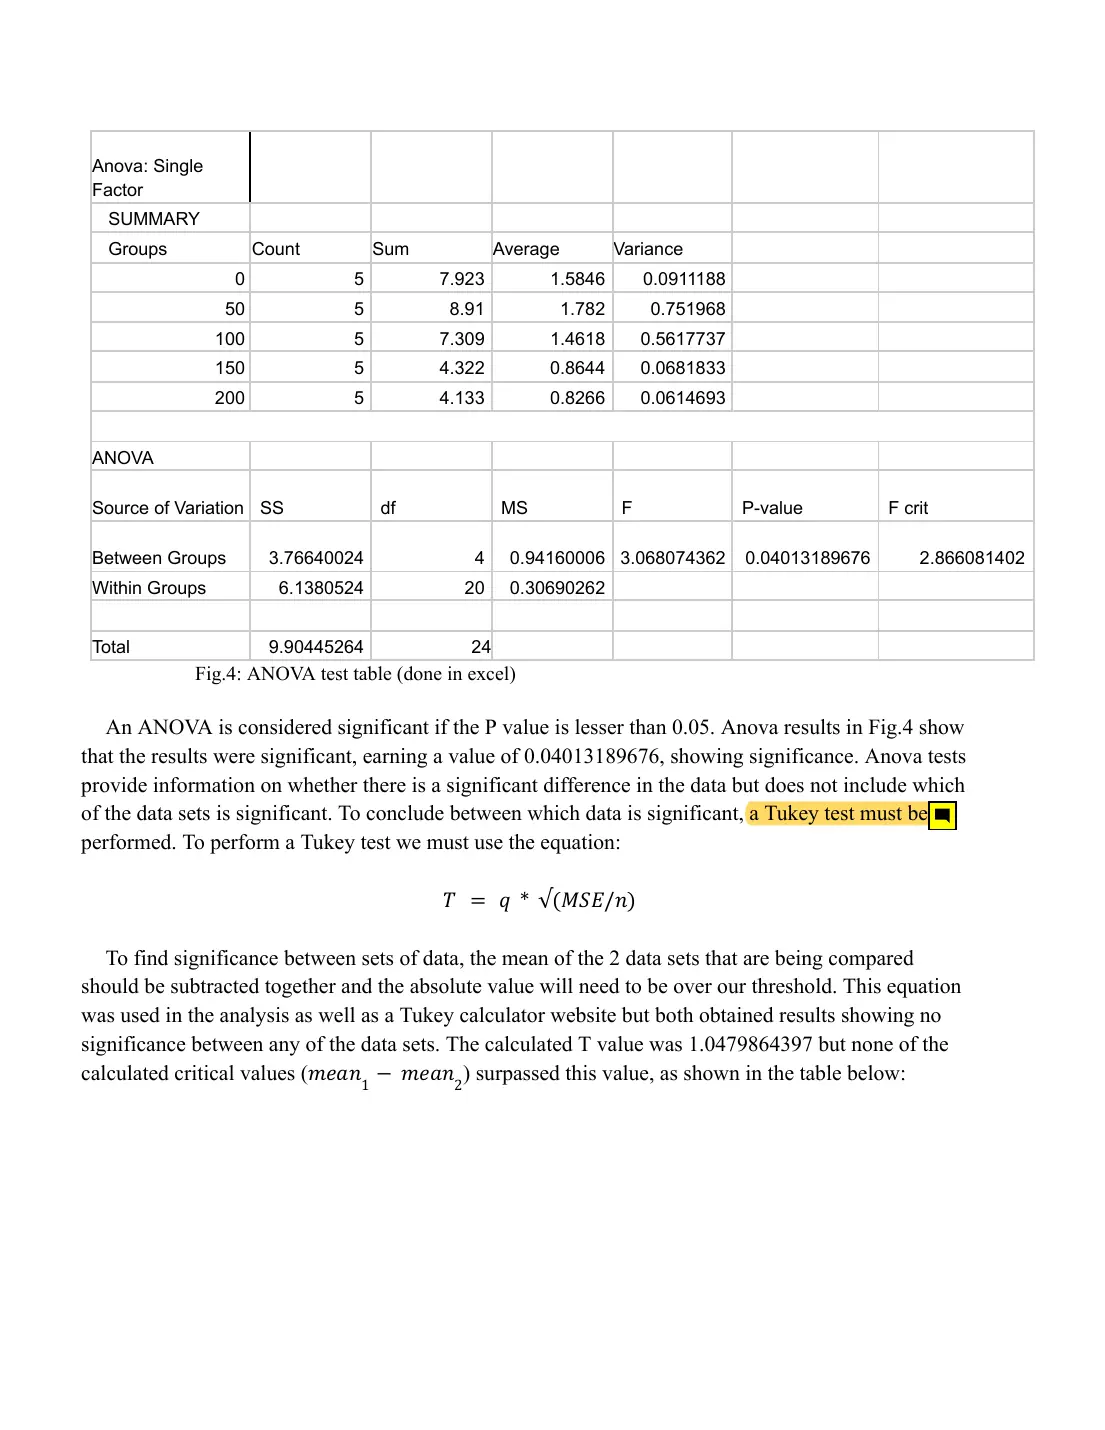
A post-hoc Tukey test follows the ANOVA and the calculation reproduces. A good point.
Page 13 of 16
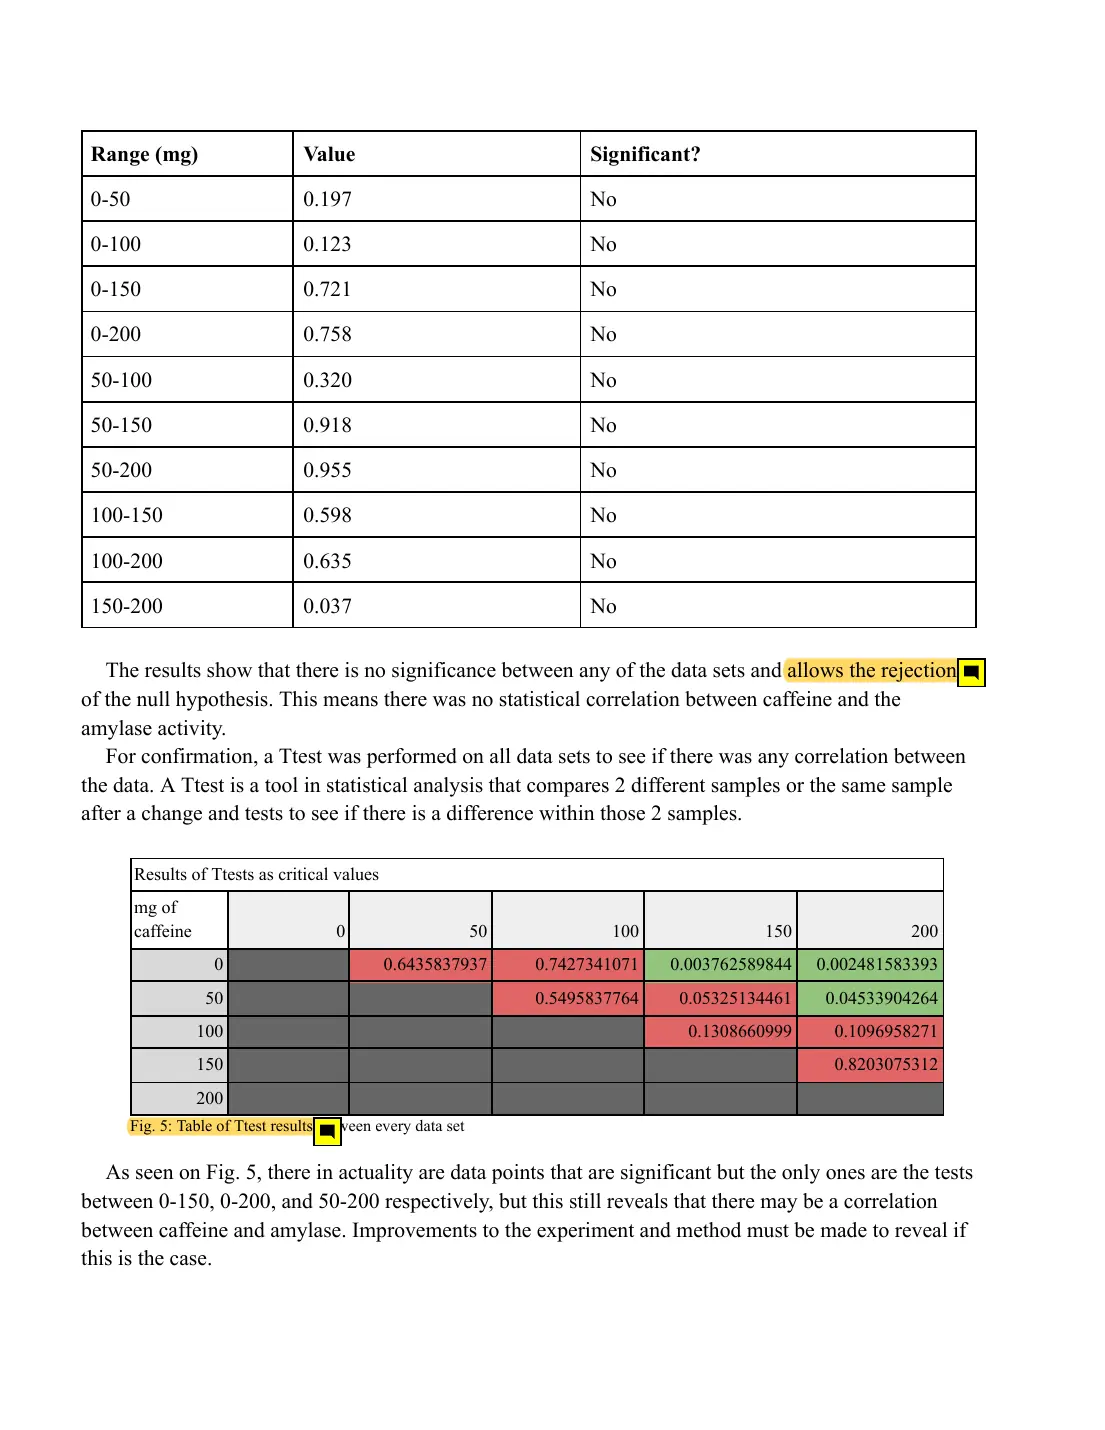
- Data analysis · third strand/conclusion, first strand
No pairwise difference is significant, so the null hypothesis is not rejected.
- Data analysis · third strand
Ten uncorrected t-tests after a Tukey test do not confirm it. The values are p-values, not critical values.
Page 14 of 16
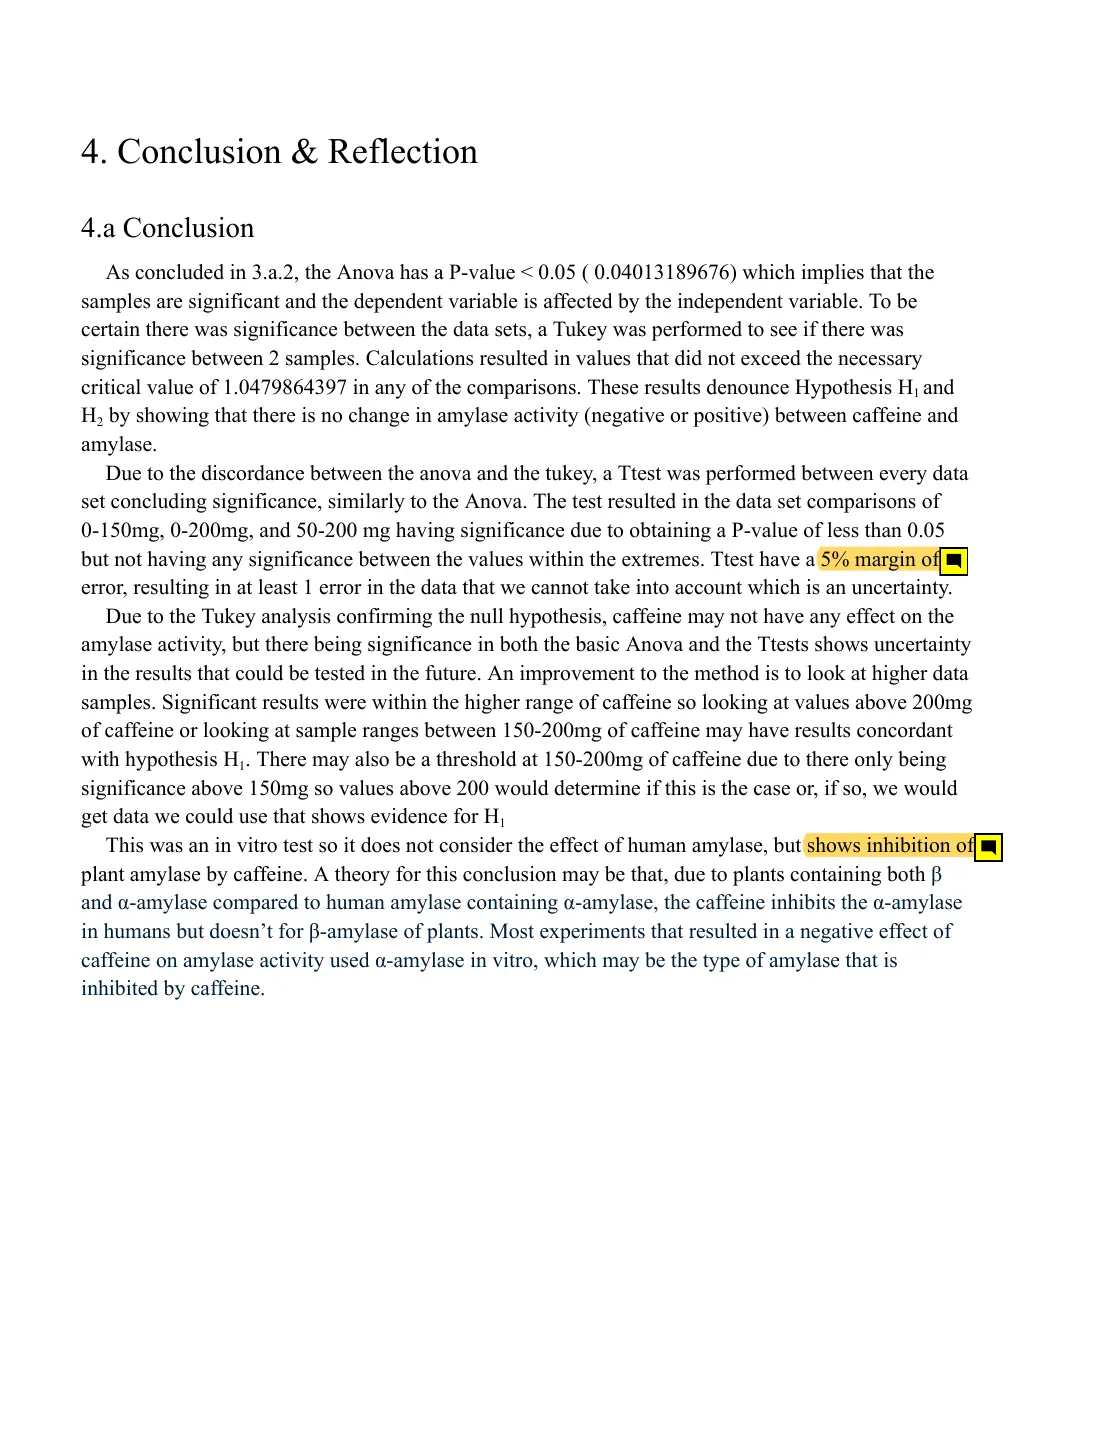
- Conclusion · first strand
A misunderstanding of the significance level.
- Conclusion · first strand/second strand
This contradicts the previous paragraph, and the source of the amylase is not stated anywhere in the method.
Page 15 of 16
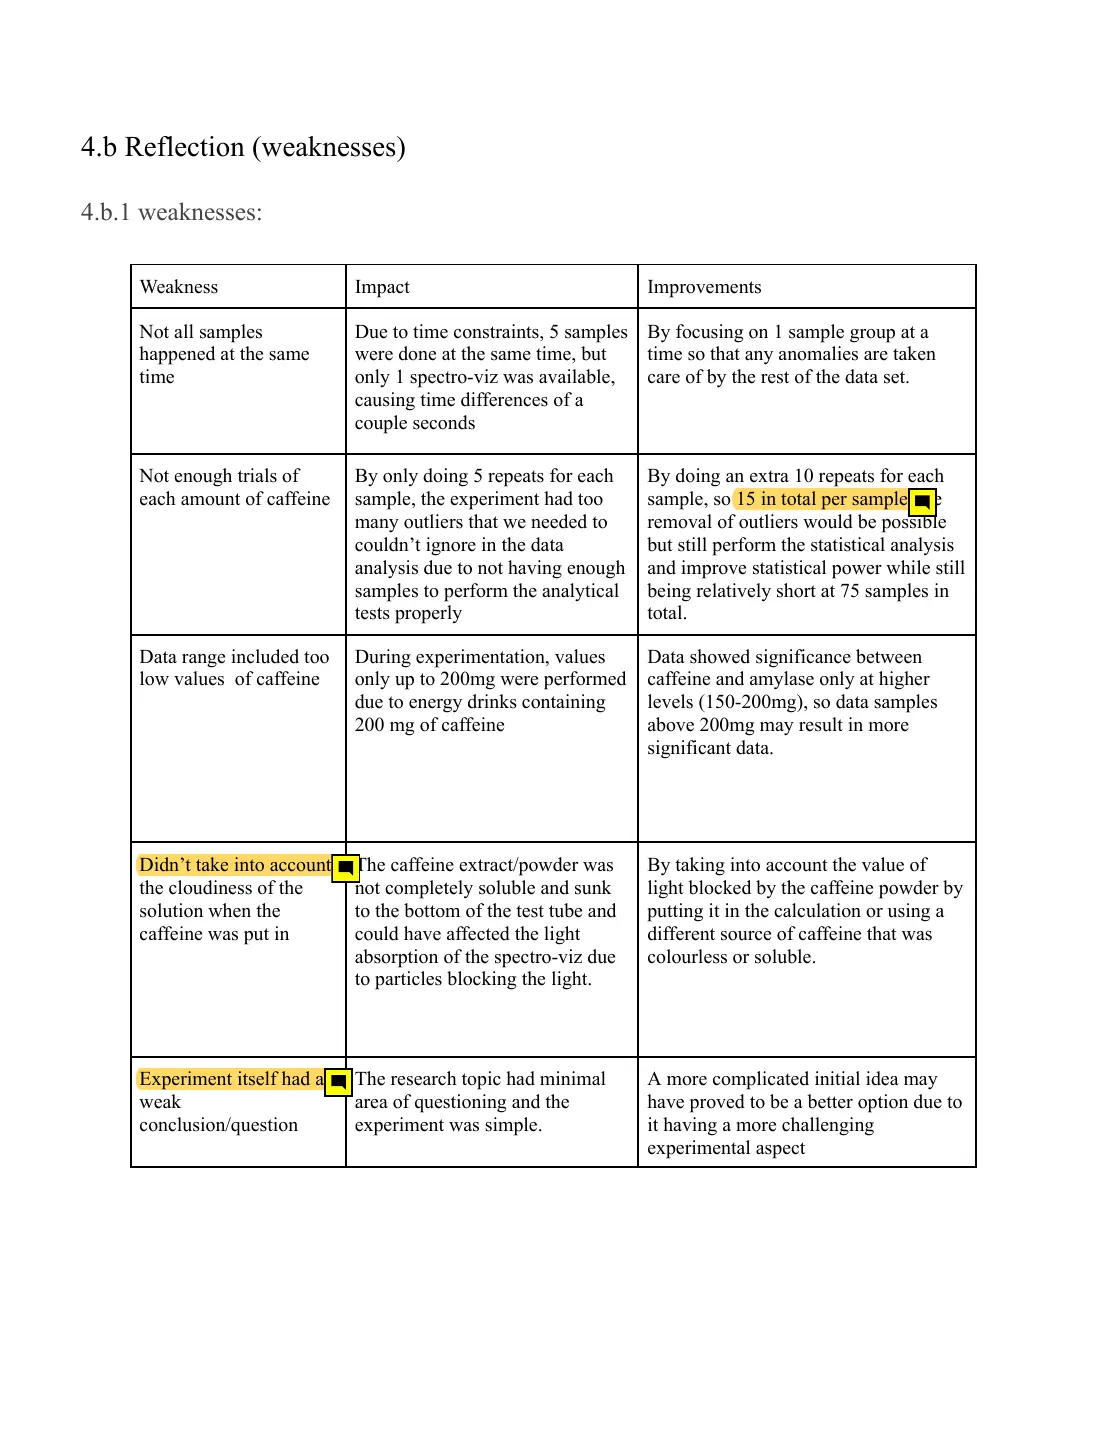
- Evaluation · second strand
A specific improvement linked to the sample size used in the analysis.
- Evaluation · first strand
A relevant weakness specific to this method, with its effect on the readings explained.
- Evaluation · first strand
Not a methodological weakness.
Page 16 of 16
Moderate one of yours
Your marks checked blind, the criterion comments written, and the script annotated like this one. Your first moderation is free.
Try it on a script →