 Biology by Bradford
Example A · 17 · Example B · 14 vs 13 · Example C · 13
Example C · a real HL script, names removed
The annotated script.
pH and germination (HL)“What is the effect of different levels of pH (6.4, 6.5, 6.6, 6.7, 6.8) on the germination rates of Brassica oleracea as measured by the presence of leaves after 7 days?”
- Mark13/24RD 4 · DA 3 · C 3 · E 3
- Second markerAgrees with the mark.
- Notes20 comments, pinned where the evidence is.
- HowTap a number on a page to read its note, or a note to find it on the page.
Page 1 of 25
Page 2 of 25
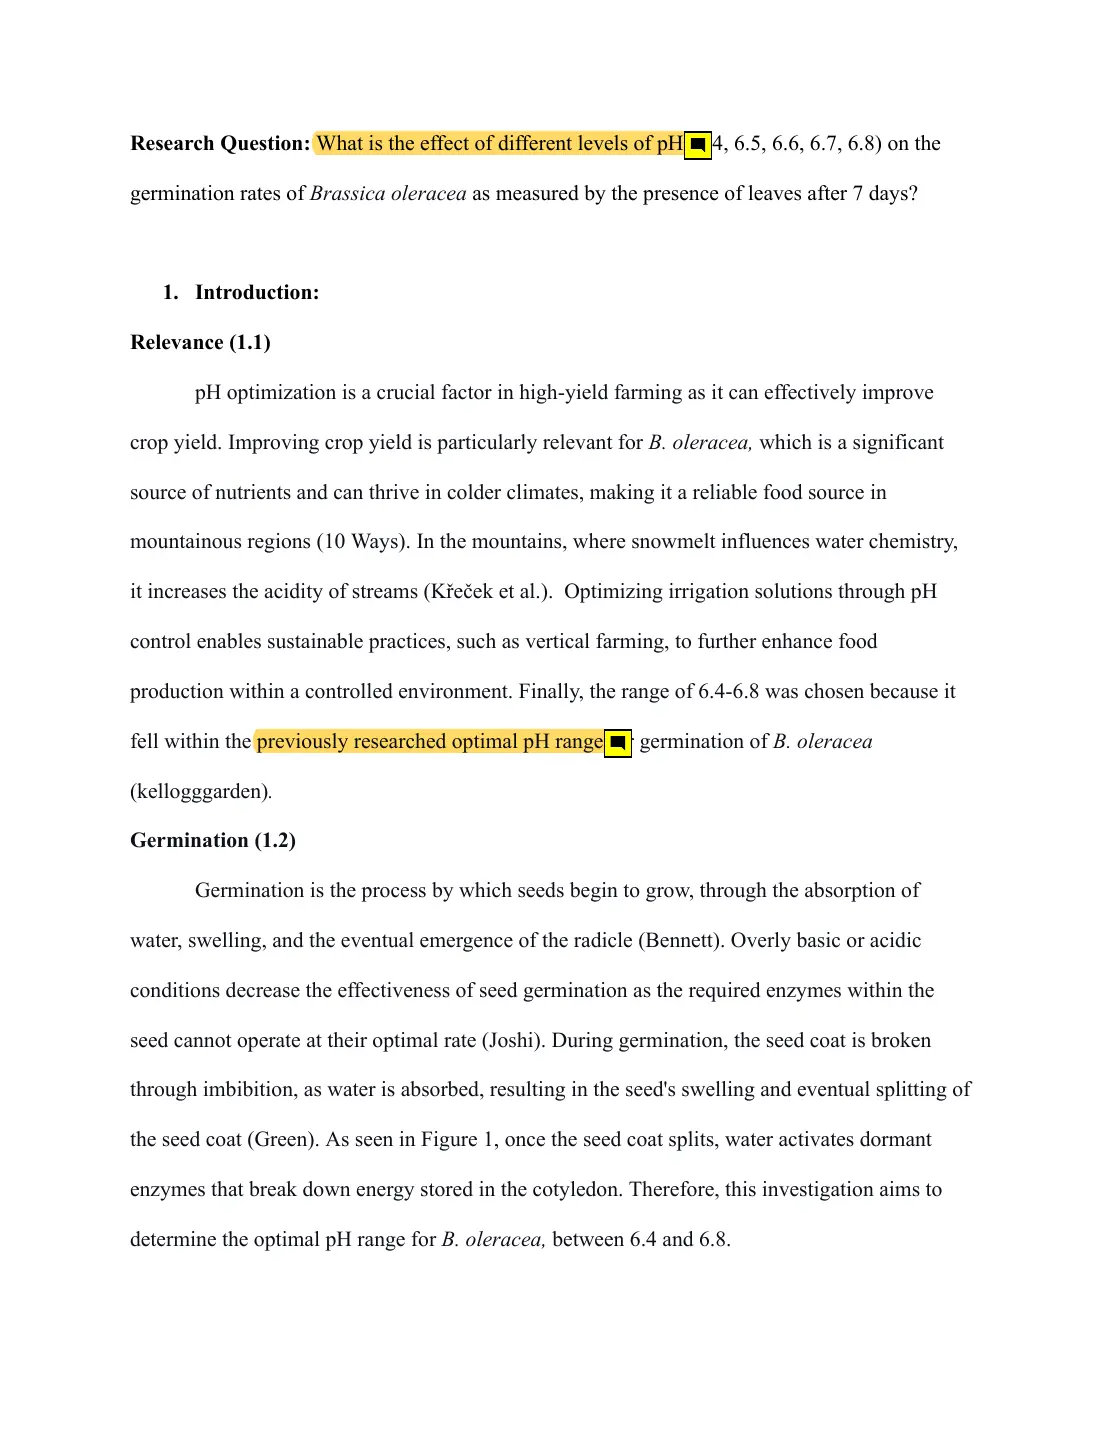
- Research design · first strand
Focused question with the values of the independent variable, the organism and the criterion for germination.
- Research design · second strand
The range is justified, but from a gardening website.
Page 3 of 25
Page 4 of 25
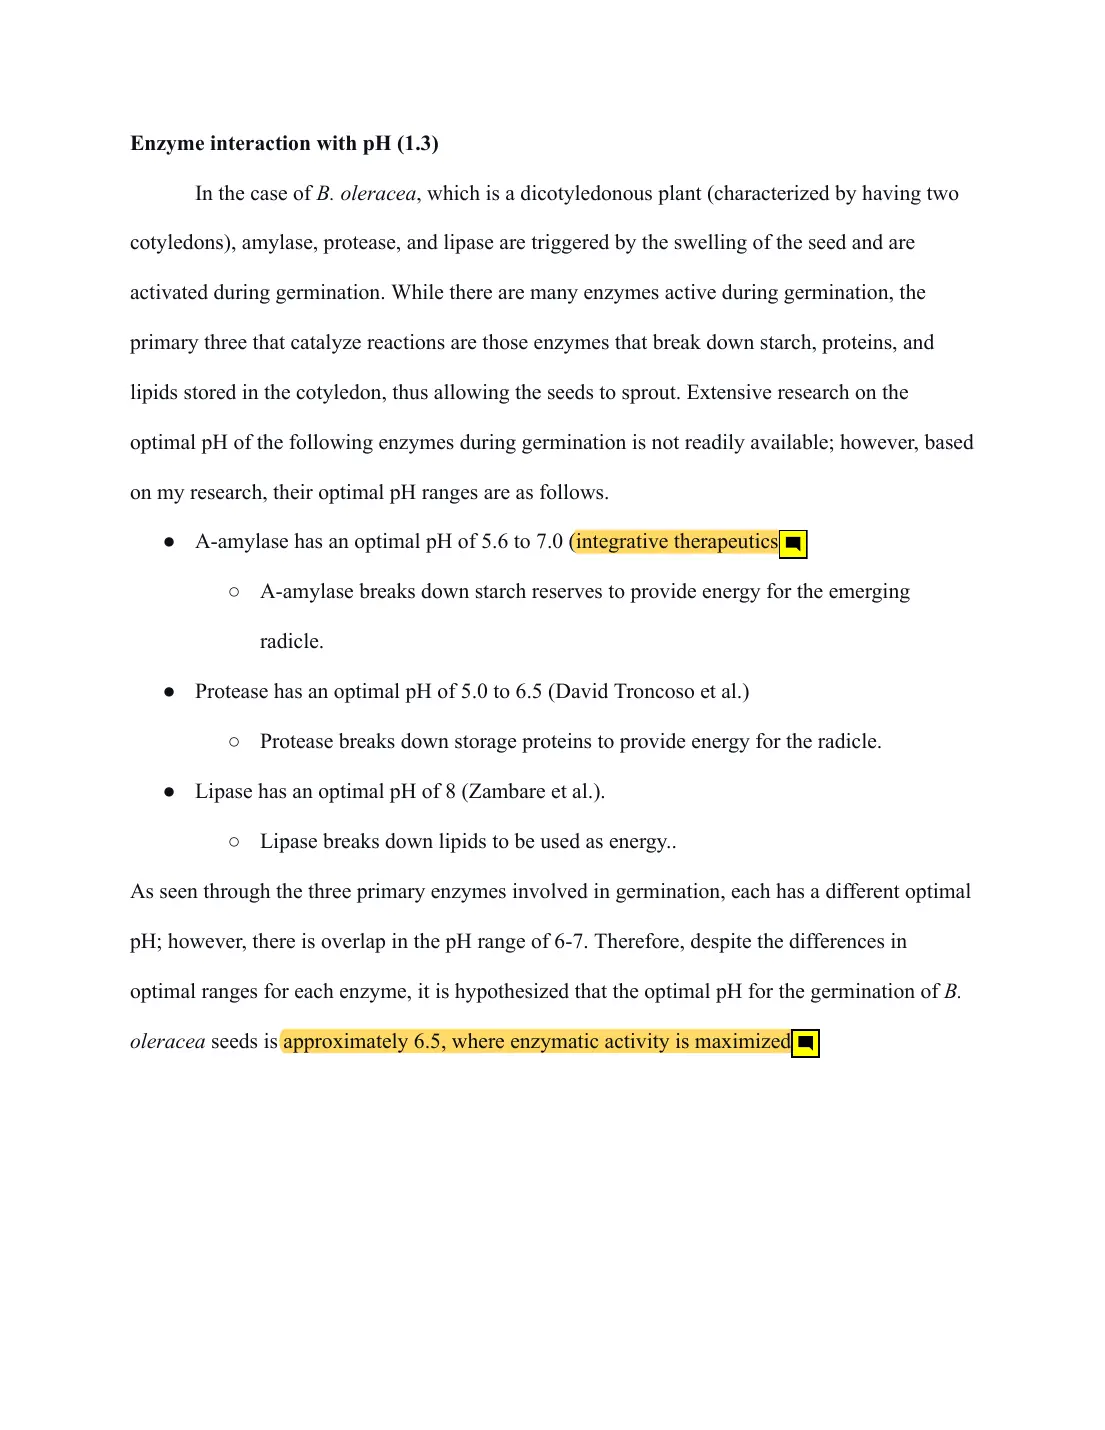
- Research design · first strand
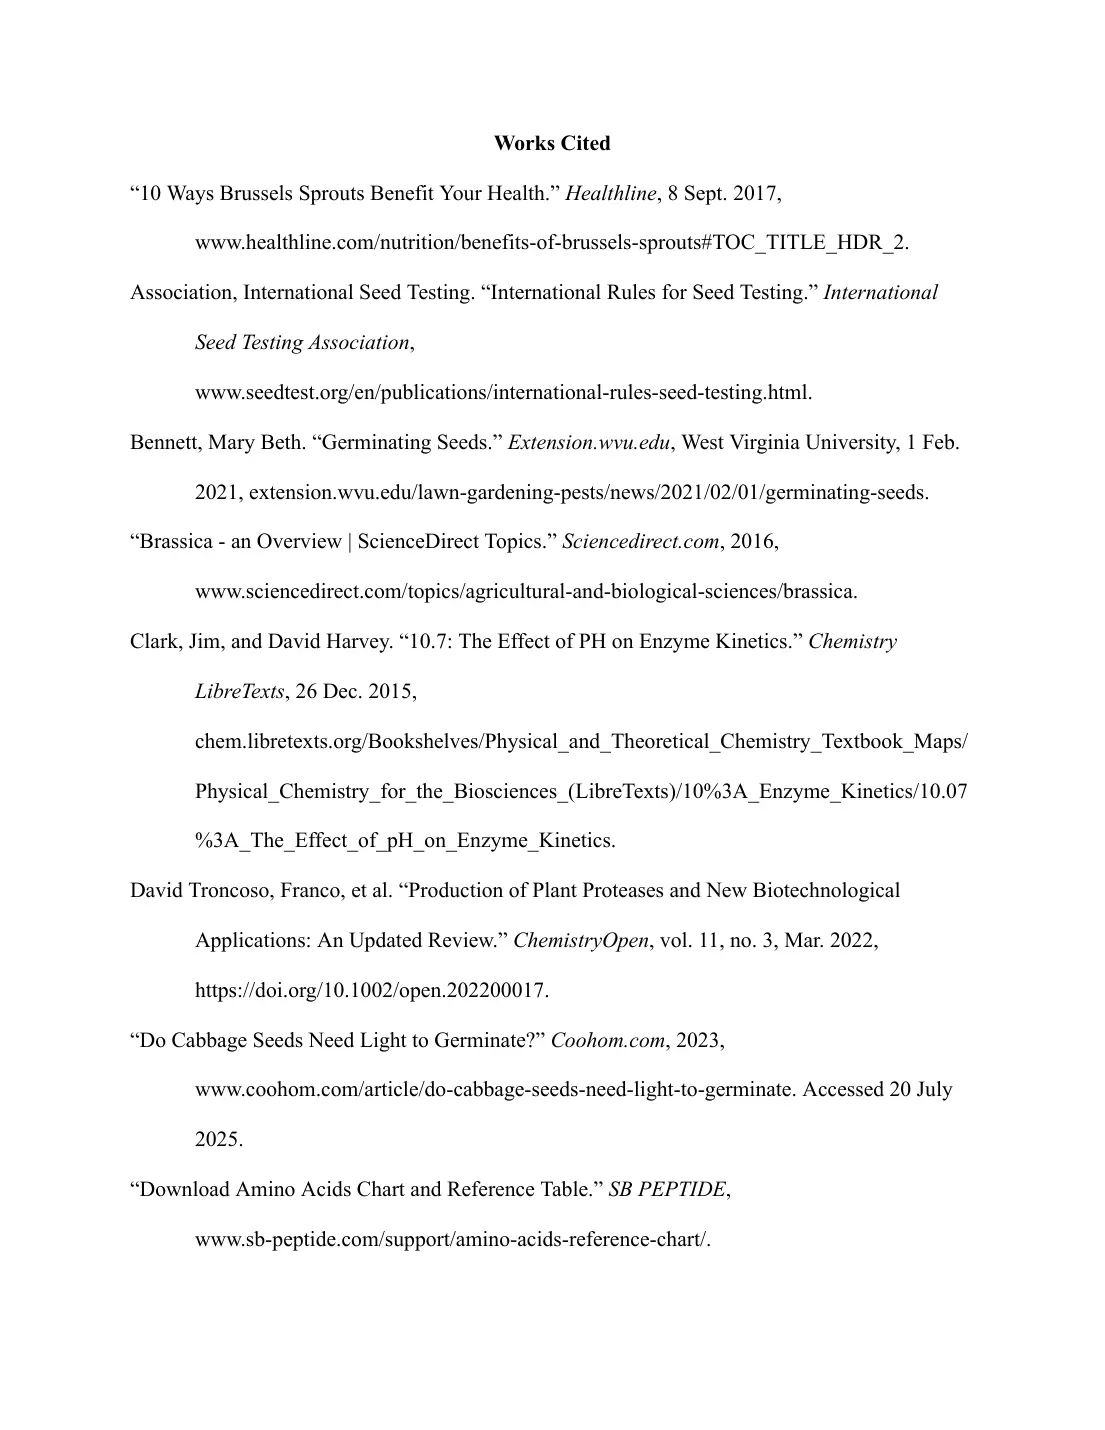
A supplement retailer's page on human digestive enzymes is used for the pH optimum of seed amylase.
- Research design · first strand
The hypothesis is explained from the overlap of the enzyme optima. A positive point.
Page 5 of 25
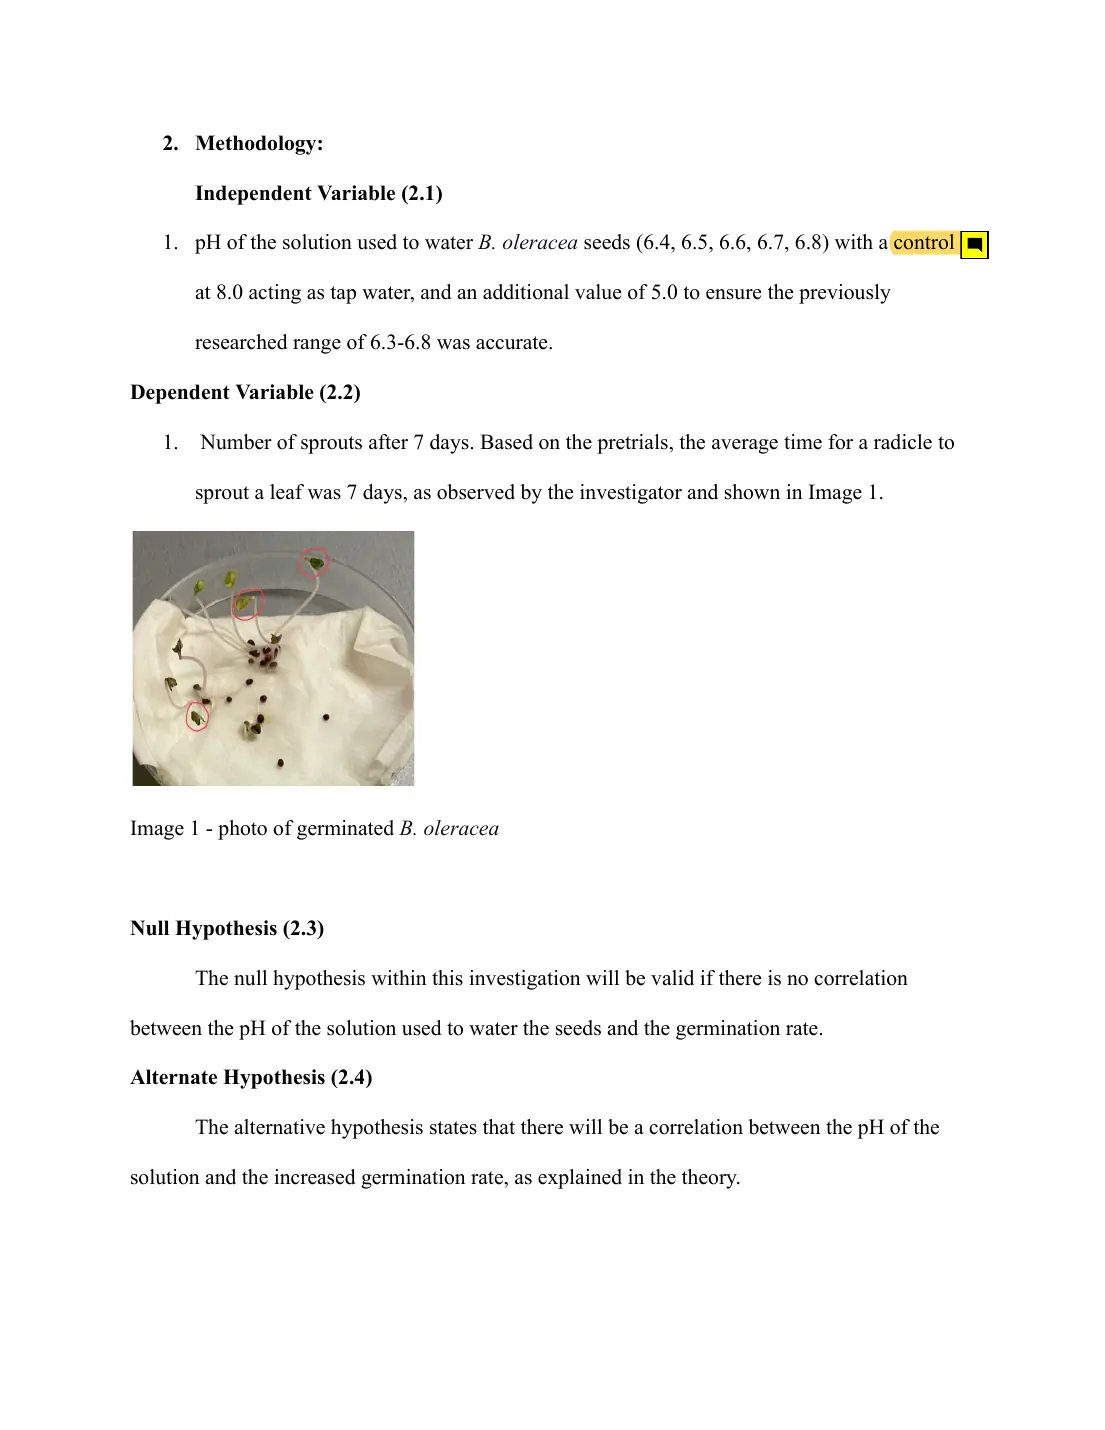
- Research design · second strand
Two values outside the range are included as comparisons, which is useful, although all solutions are made with distilled water.
Page 6 of 25
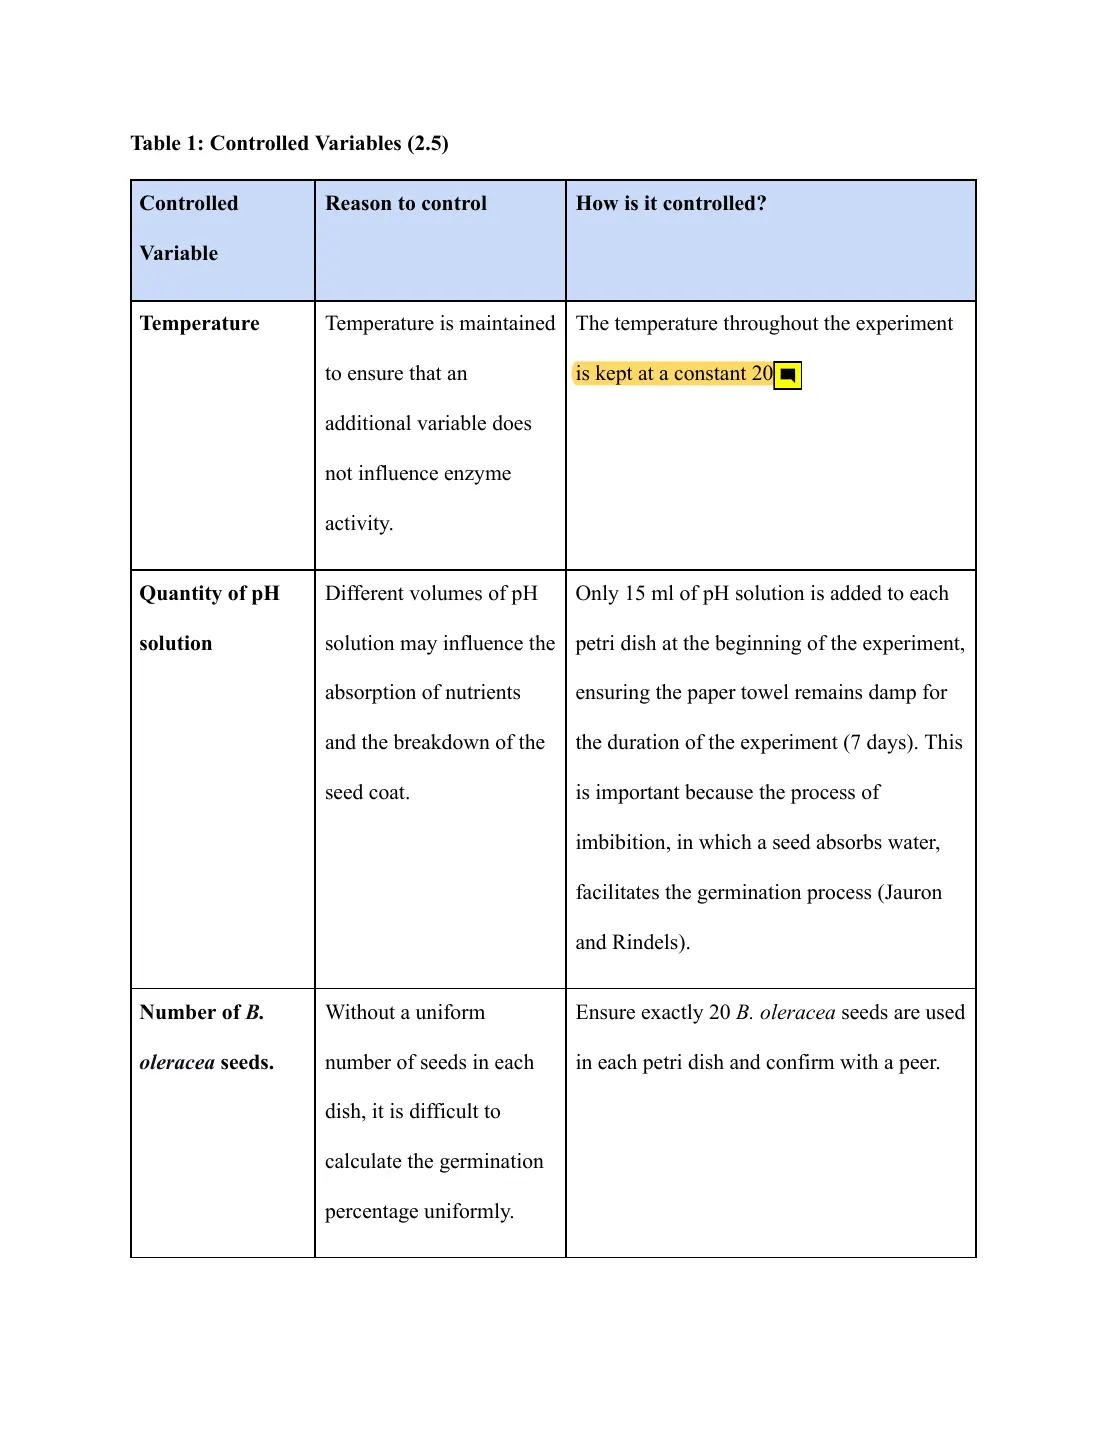
- Research design · third strand
How was this achieved or monitored? Light is not controlled either.
Page 7 of 25
Page 8 of 25
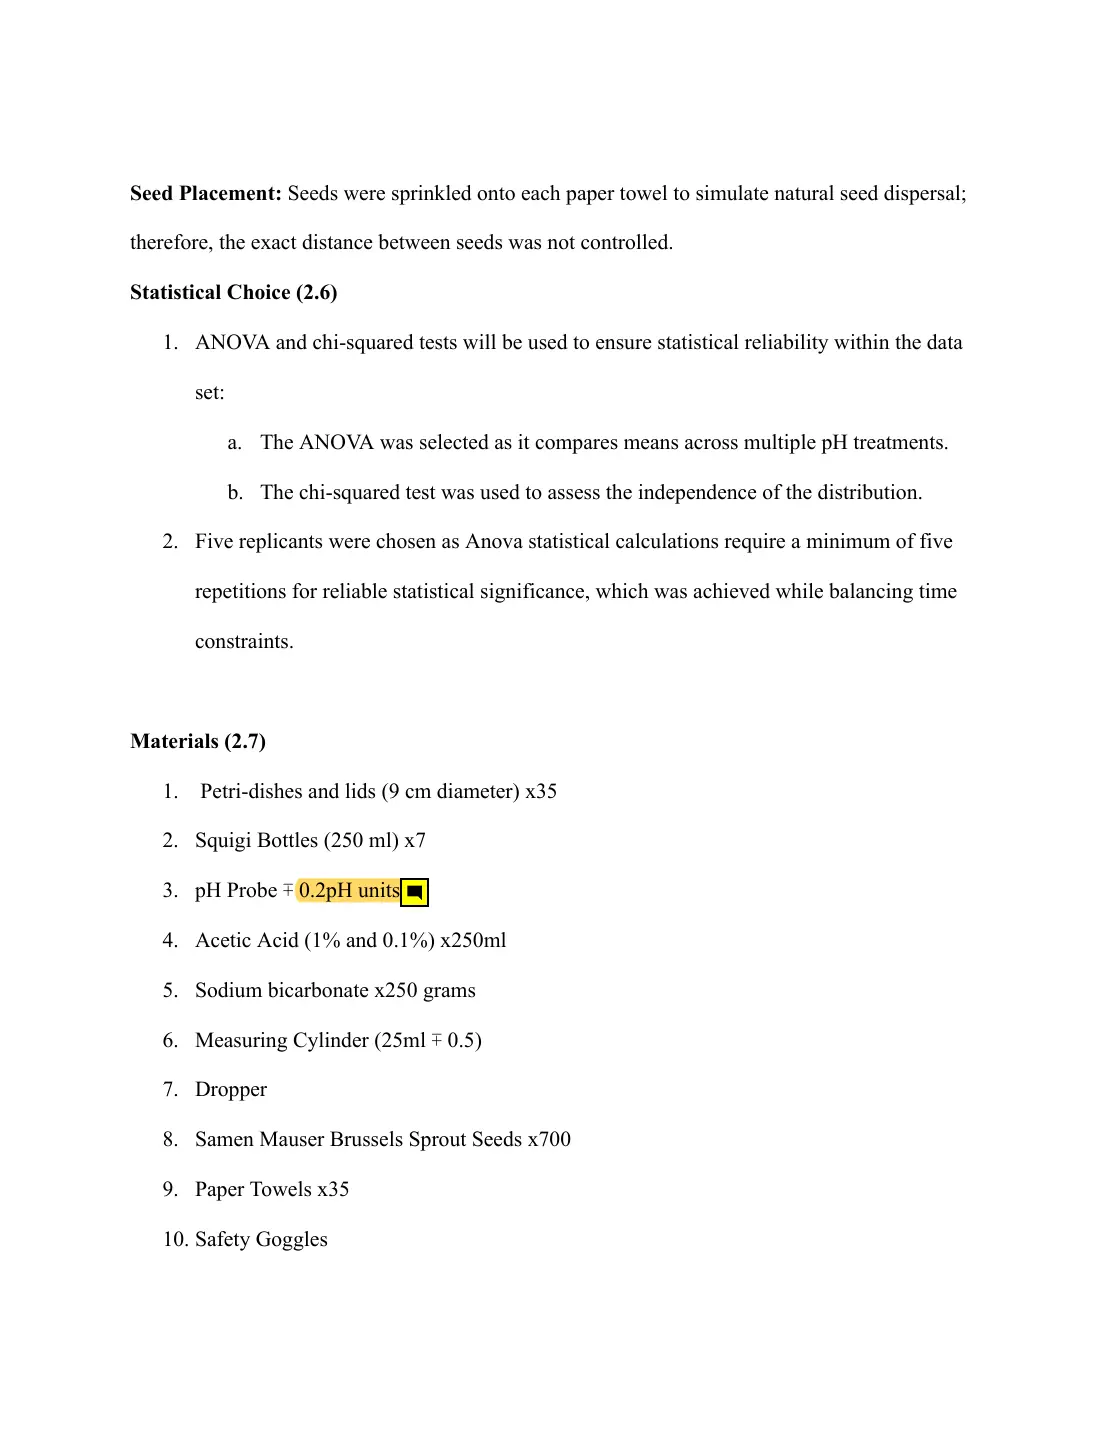
- Research design · second strand
The probe uncertainty is larger than the 0.1 interval between treatments.
Page 9 of 25
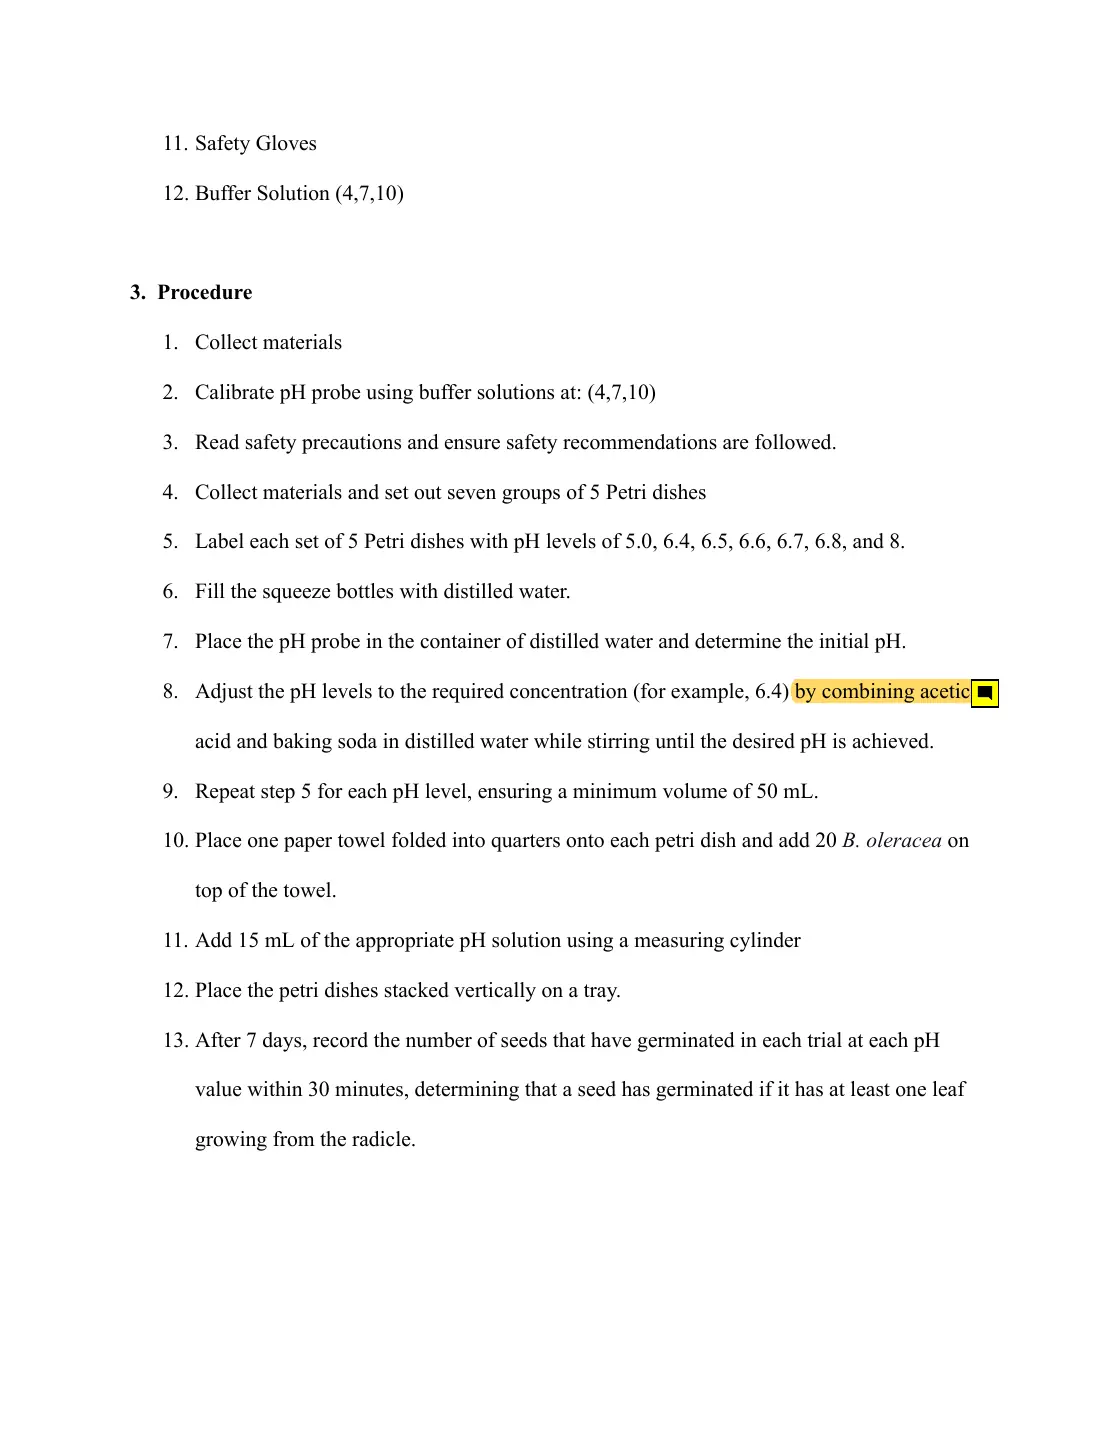
- Research design · third strand
Quantities of acid and bicarbonate are not given, and the solutions are not buffered or checked after setup.
Page 10 of 25
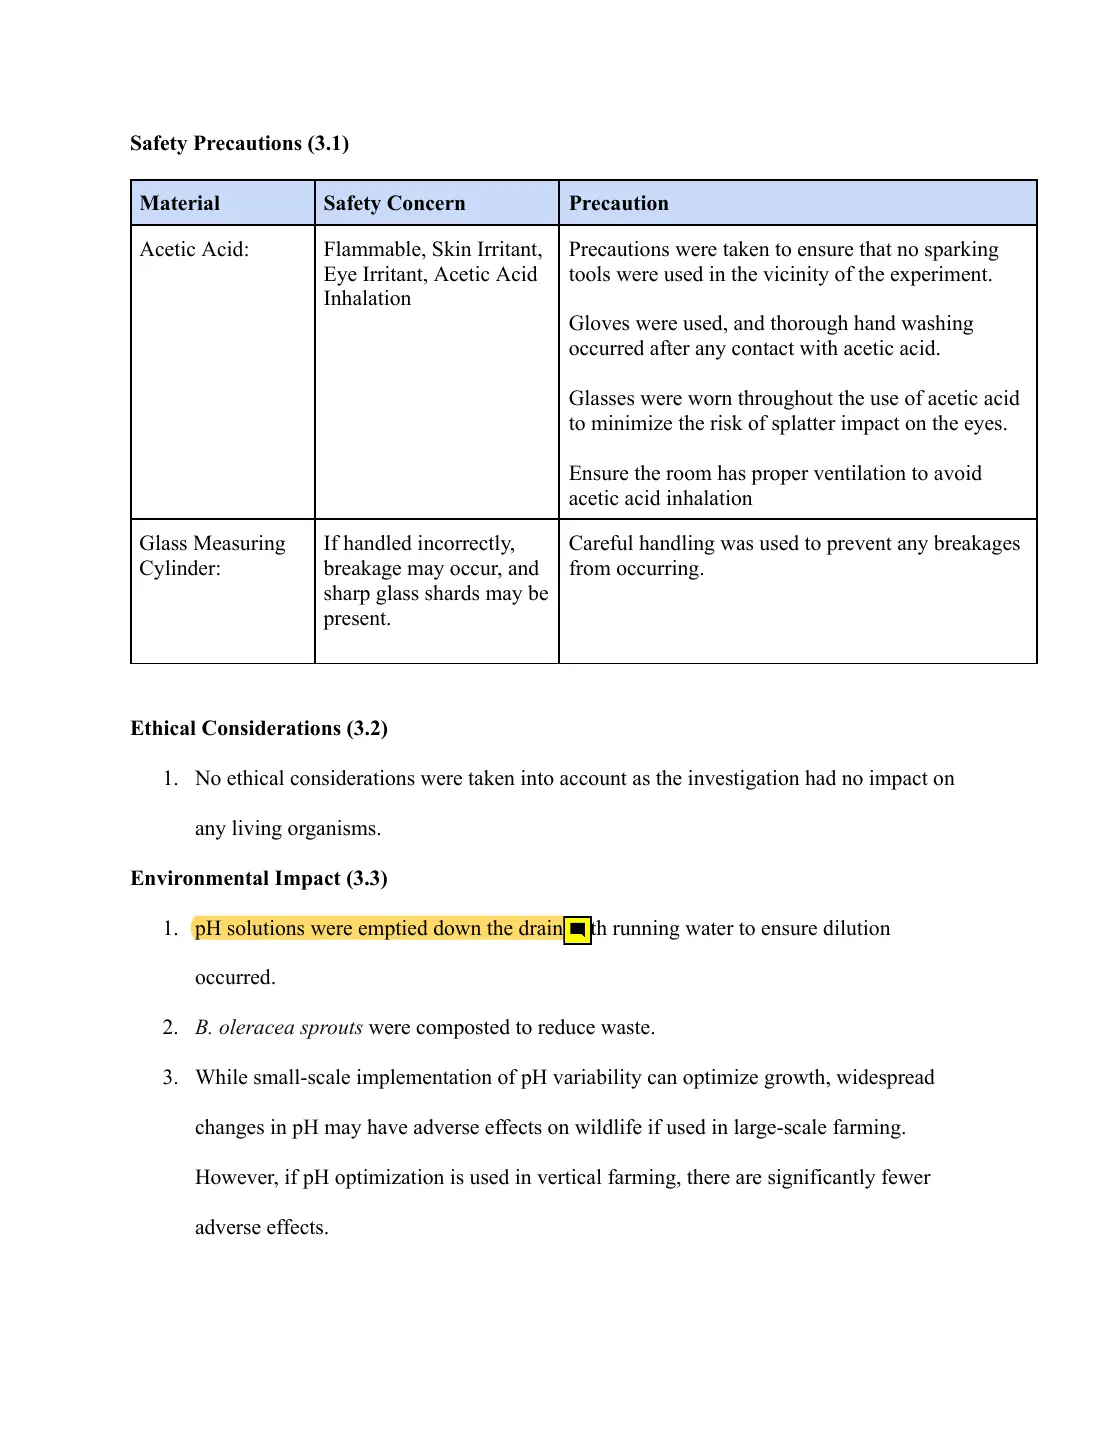
- Research design · second strand
Disposal and environmental impact are addressed.
Page 11 of 25
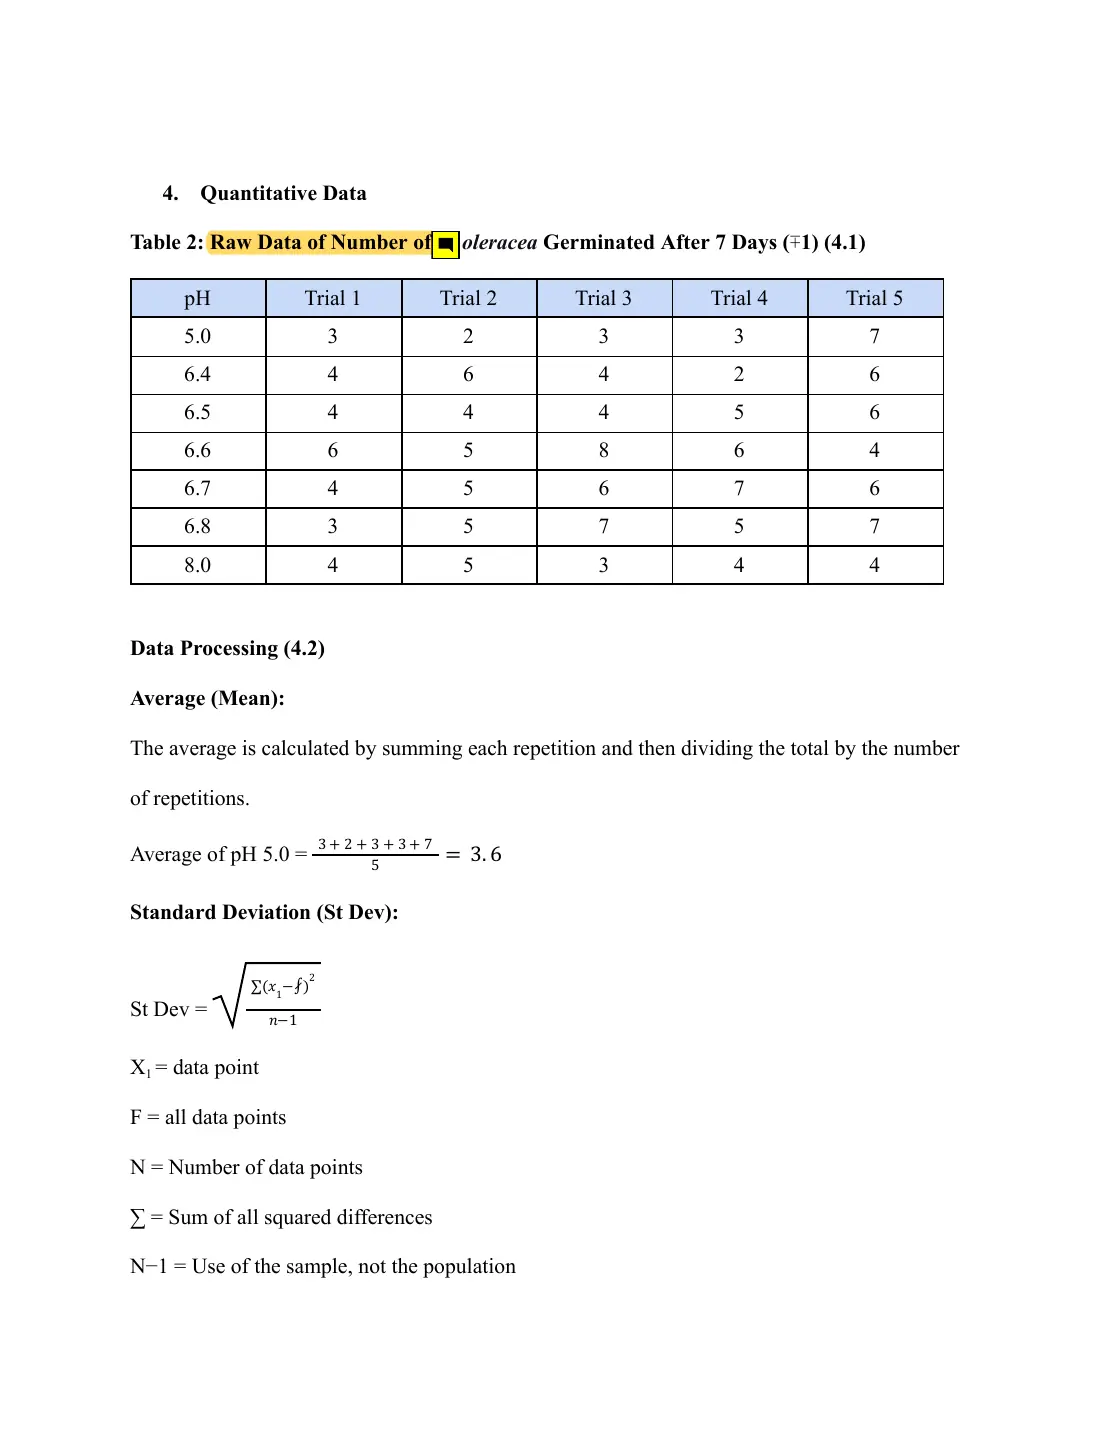
- Data analysis · first strand
Raw data are presented with an uncertainty in the heading.
Page 12 of 25
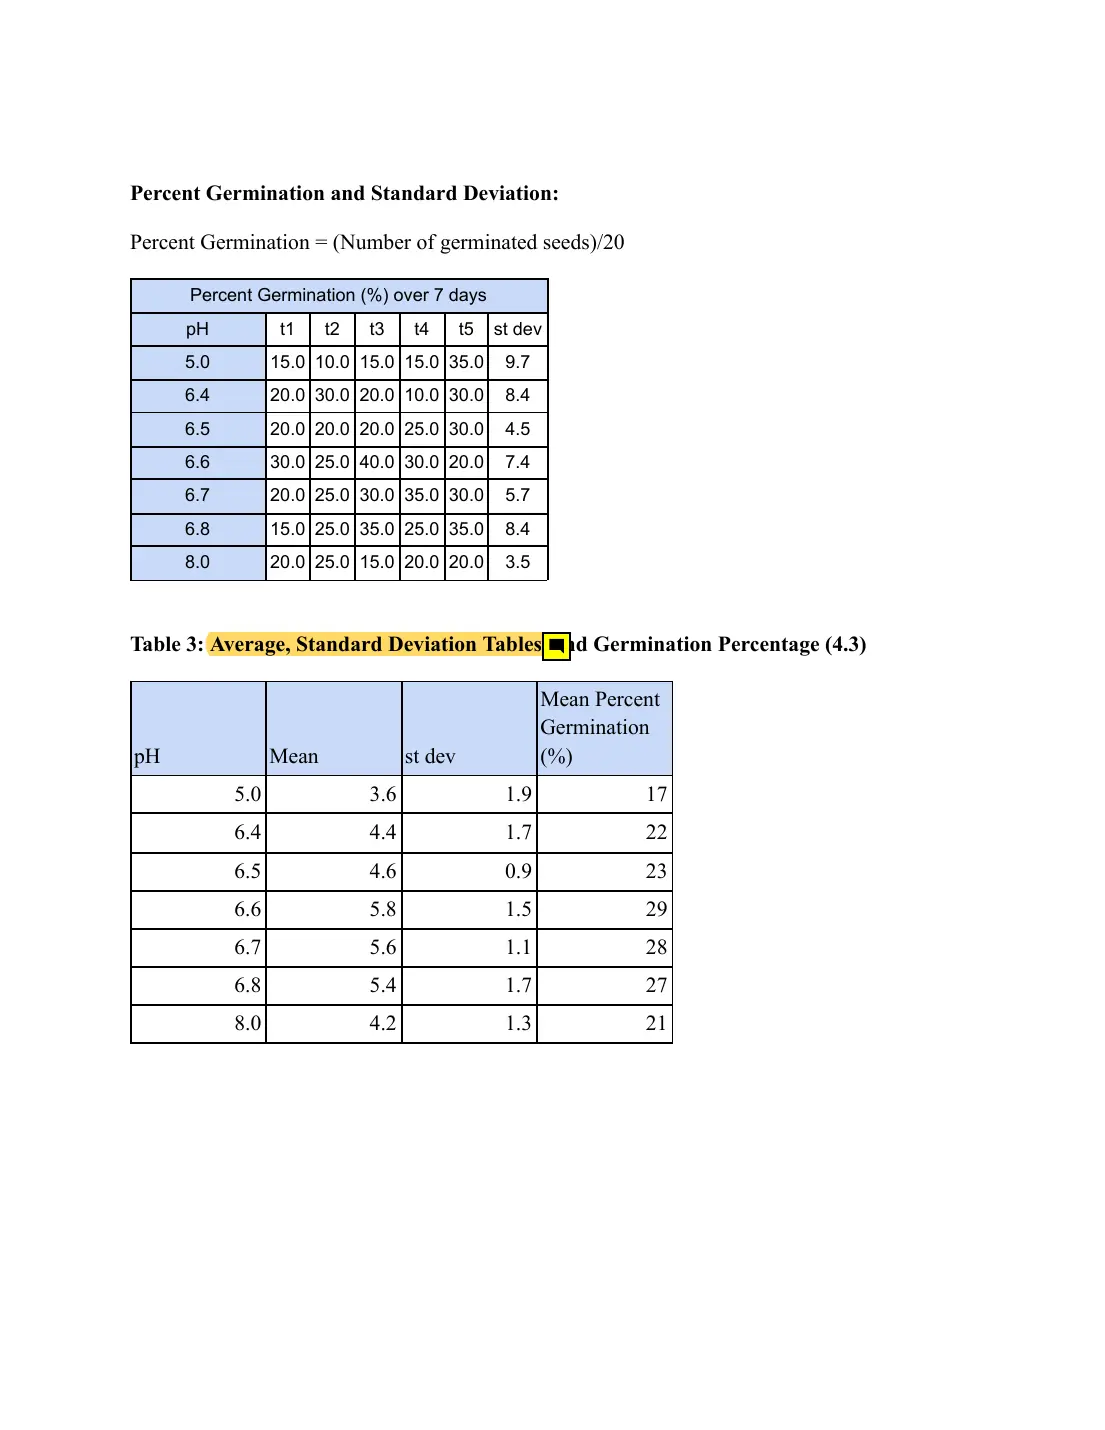
- Data analysis · third strand
The pH 8.0 row does not follow from Table 2: the mean is 4.0 and the SD 0.7.
Page 13 of 25
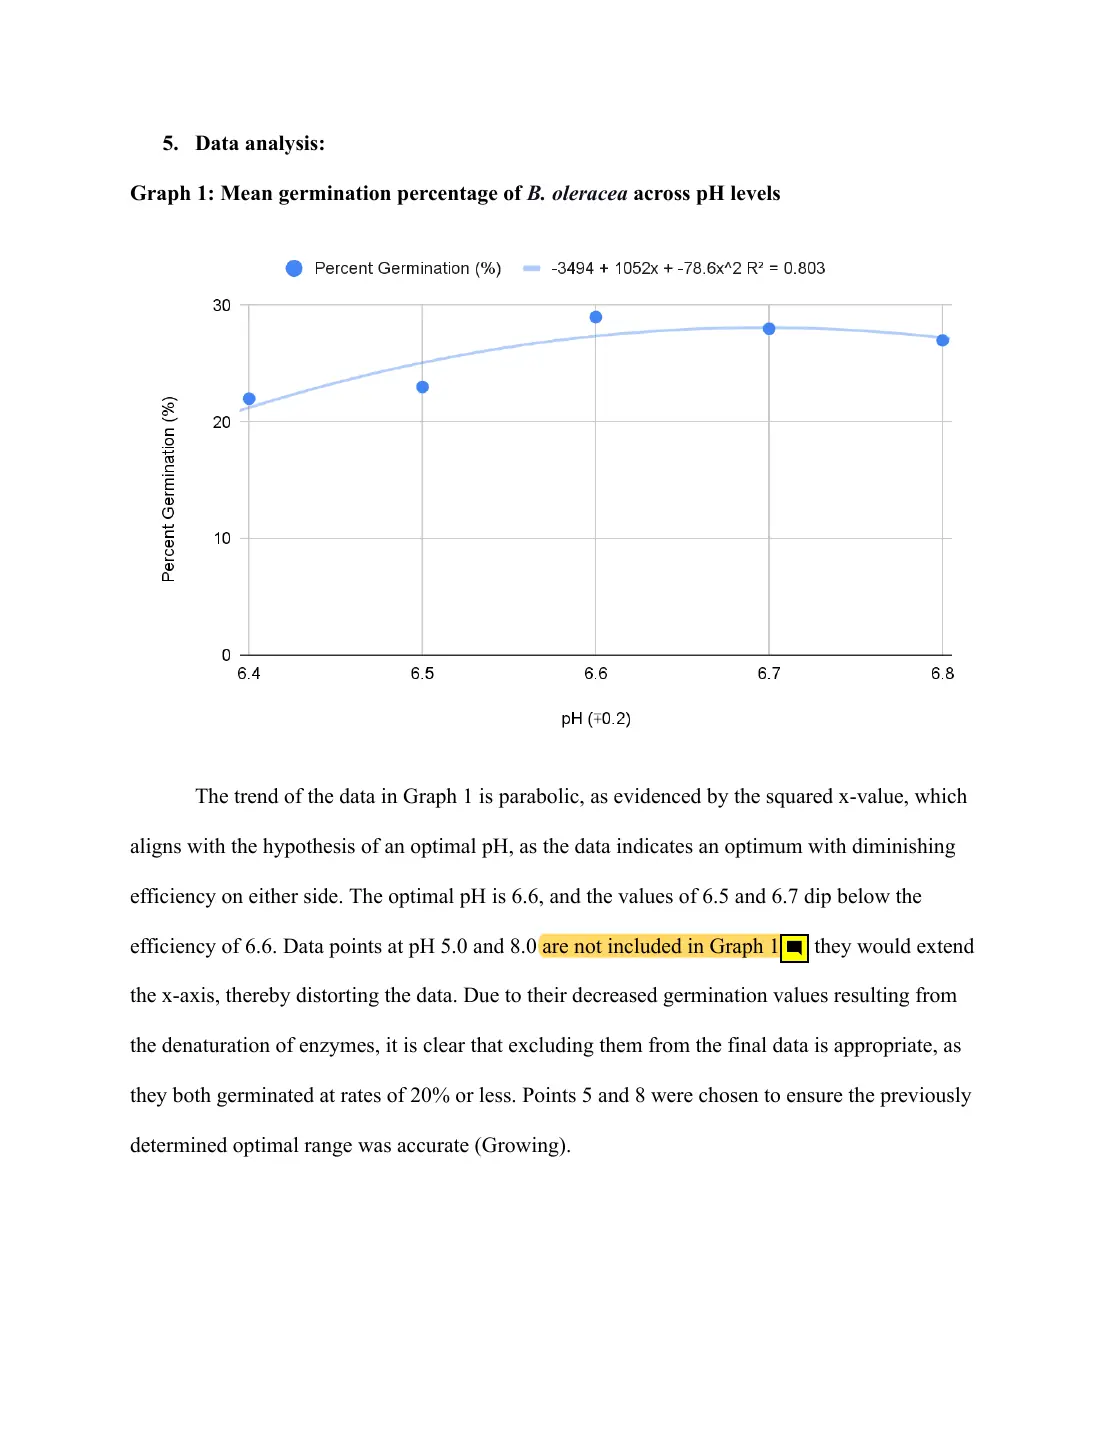
- Data analysis · first strand
pH 5.0 and 8.0 are excluded from the graph but included in the ANOVA. Their germination is close to pH 6.4.
Page 14 of 25
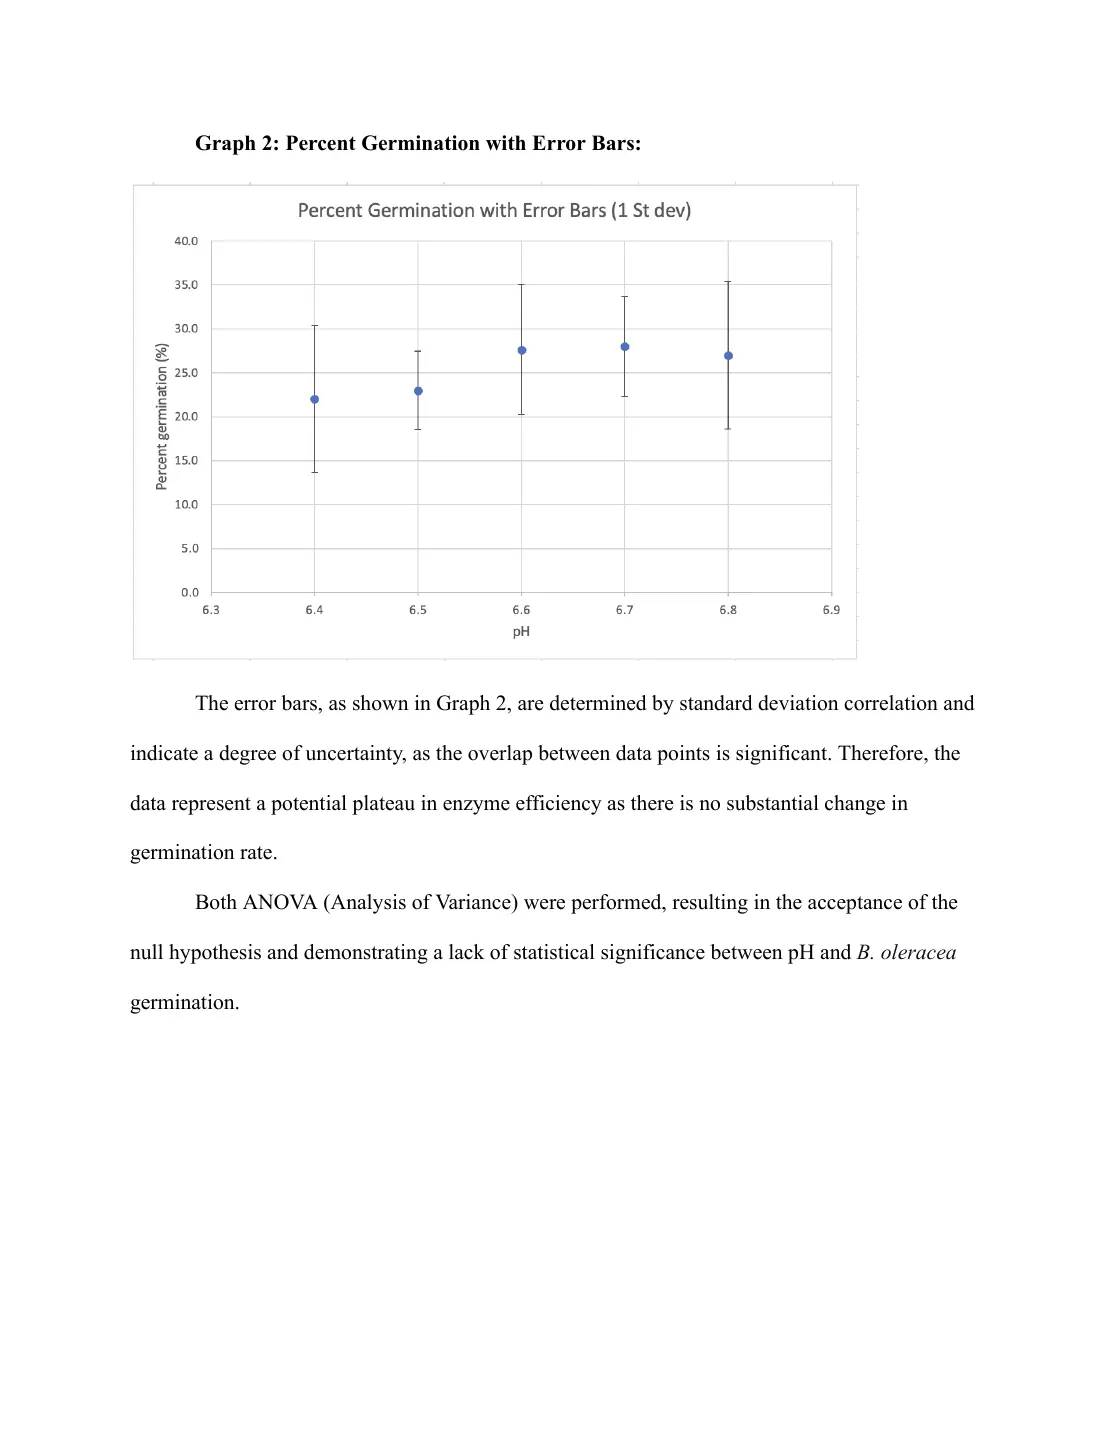
Page 15 of 25
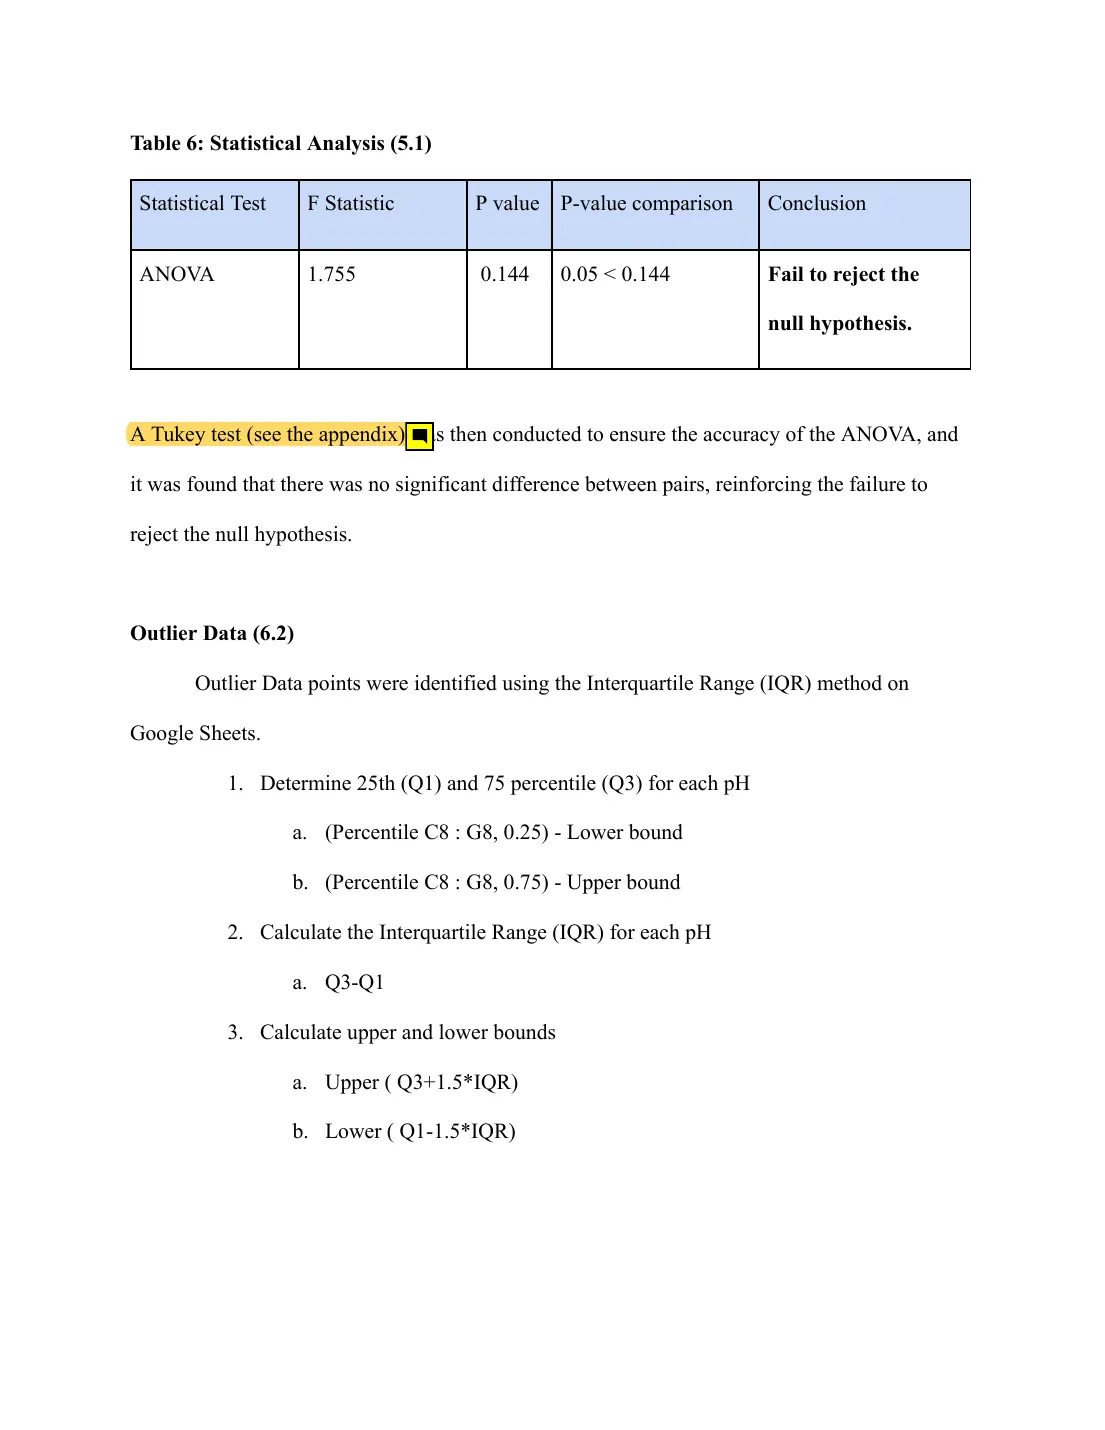
- Data analysis · third strand
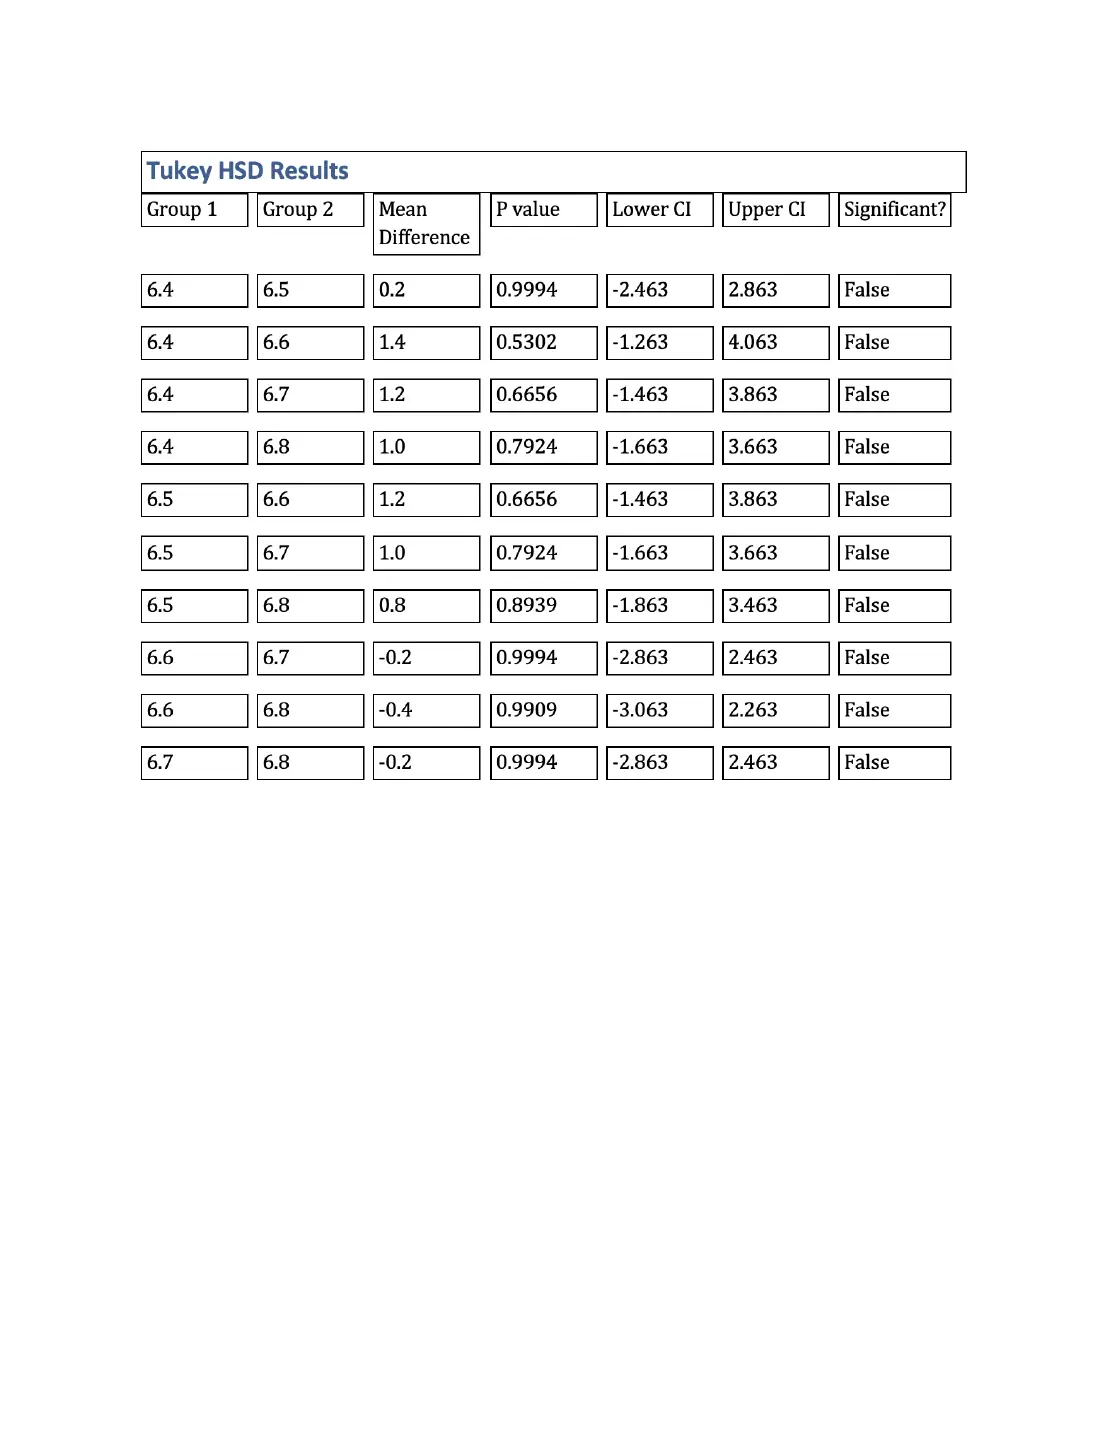
The appendix Tukey test covers five groups and the ANOVA seven. The chi-squared test planned in 2.6 is not reported.
Page 16 of 25
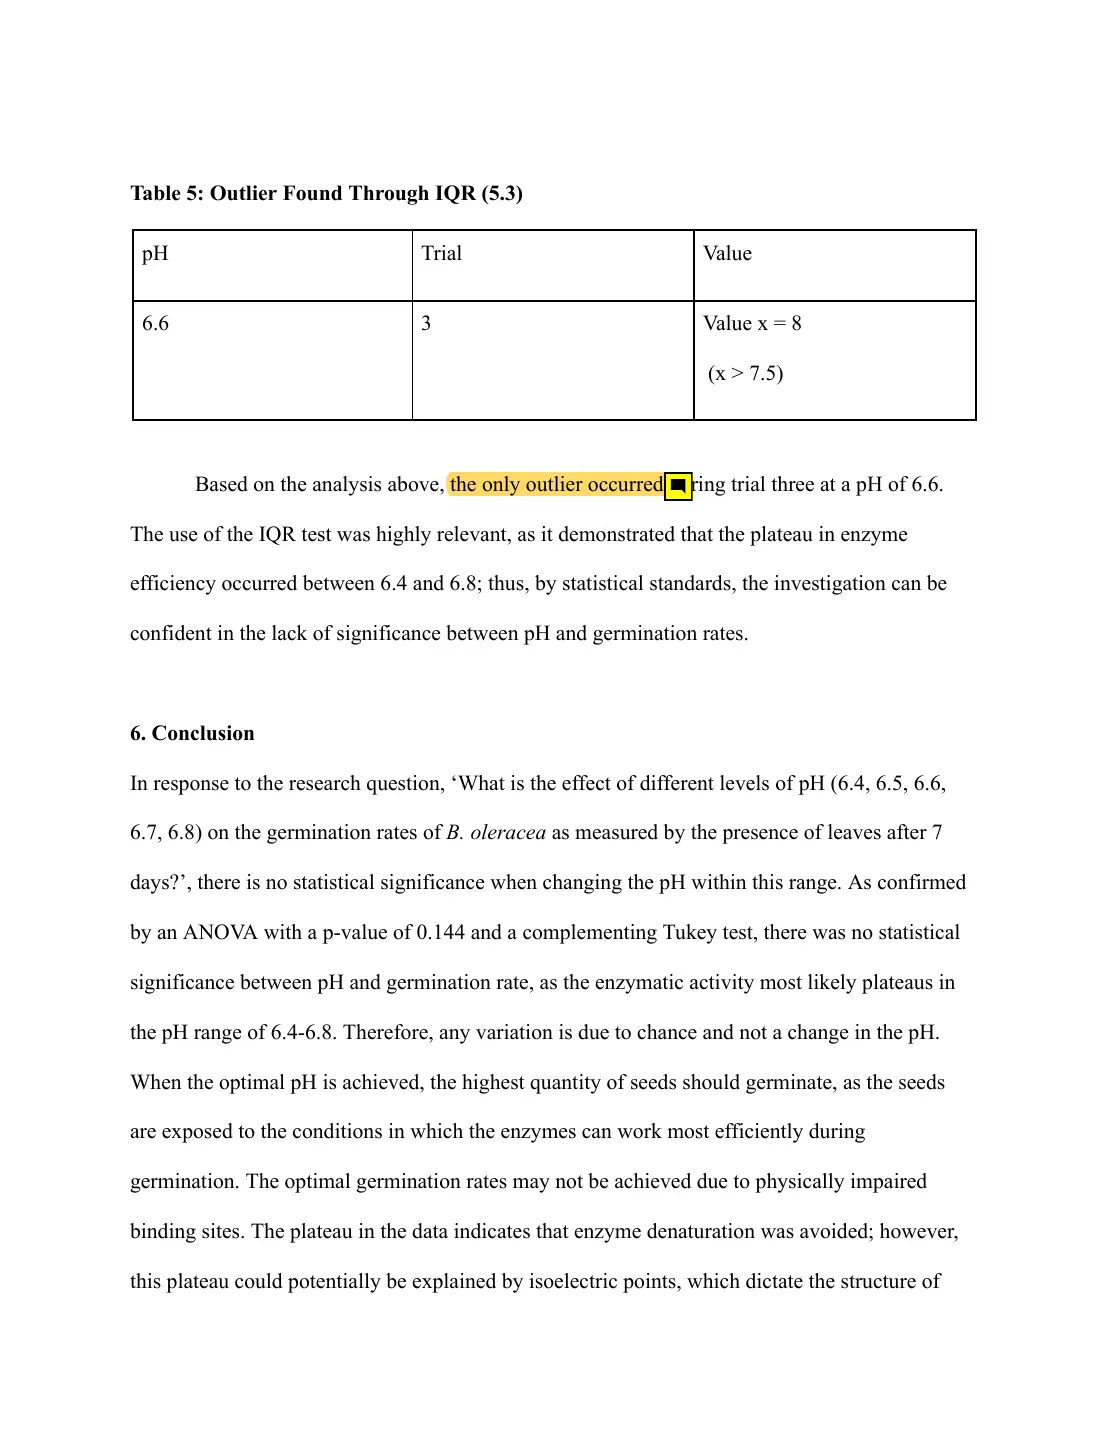
- Data analysis · third strand
The same rule also flags values at pH 5.0 and 8.0. What is done with the outlier is not stated.
Page 17 of 25
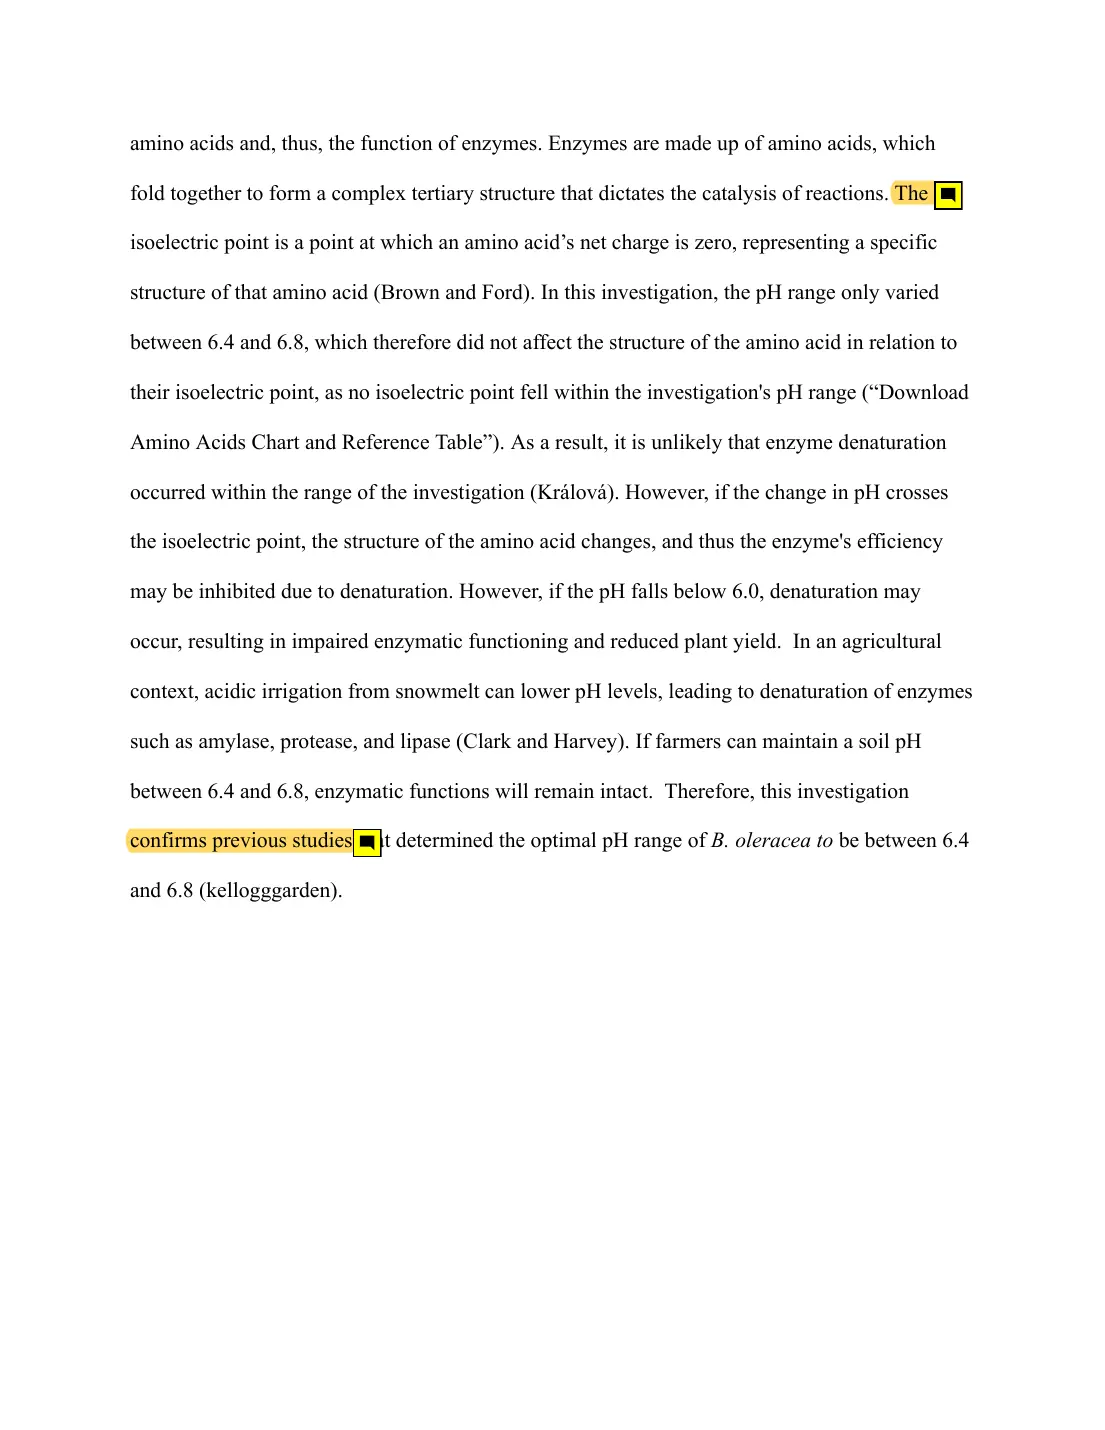
- Conclusion · second strand
The isoelectric point of individual amino acids does not explain enzyme denaturation in this way.
- Conclusion · first strand
No significant difference was found, so the results cannot confirm an optimum range.
Page 18 of 25
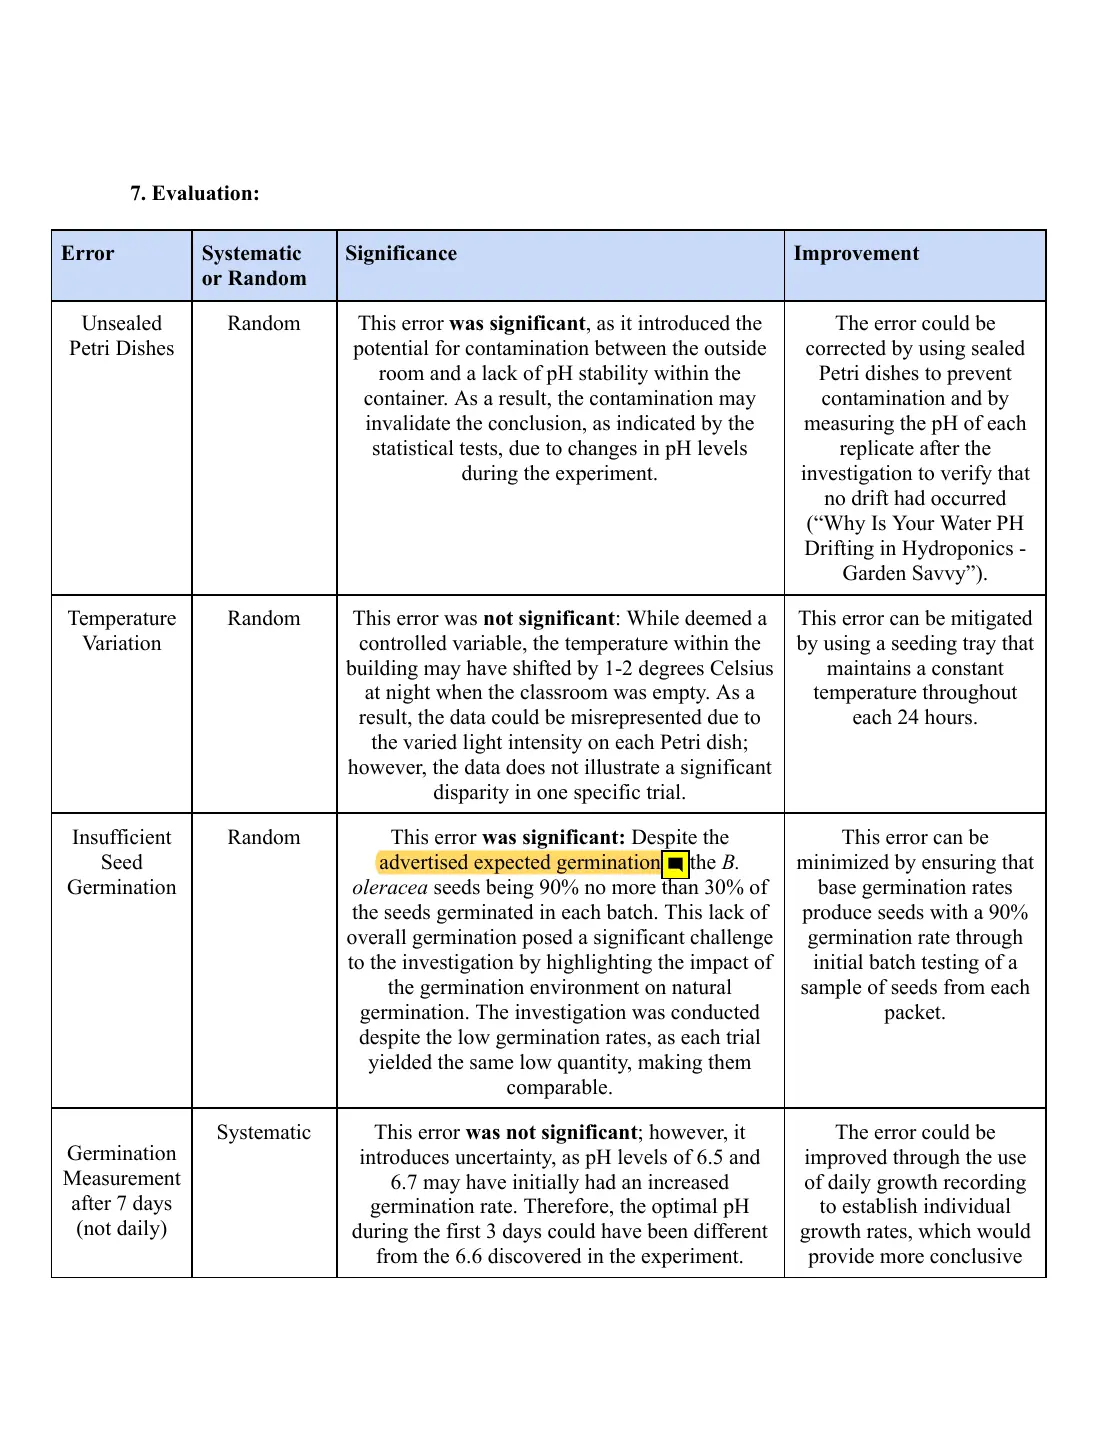
- Evaluation · first strand
A weakness evidenced from the data, set against the supplier's figure. A positive point.
Page 19 of 25
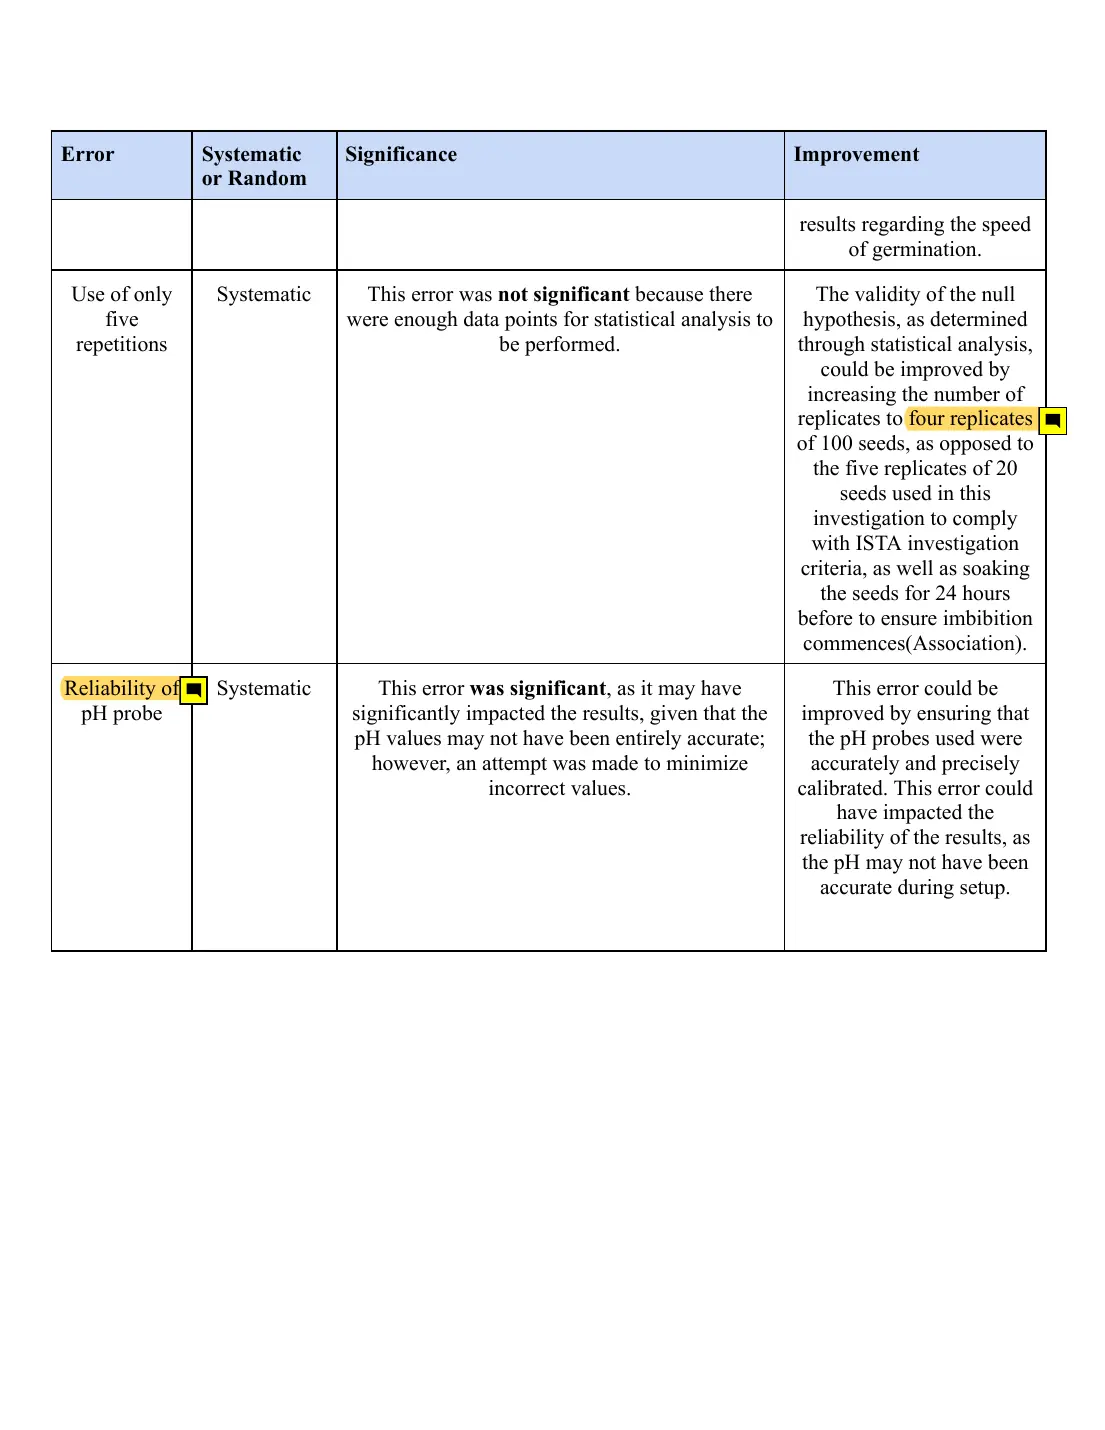
- Evaluation · second strand
A specific improvement with a source (ISTA).
- Evaluation · first strand
Vague. The size of the probe uncertainty relative to the intervals is not considered.
Page 20 of 25
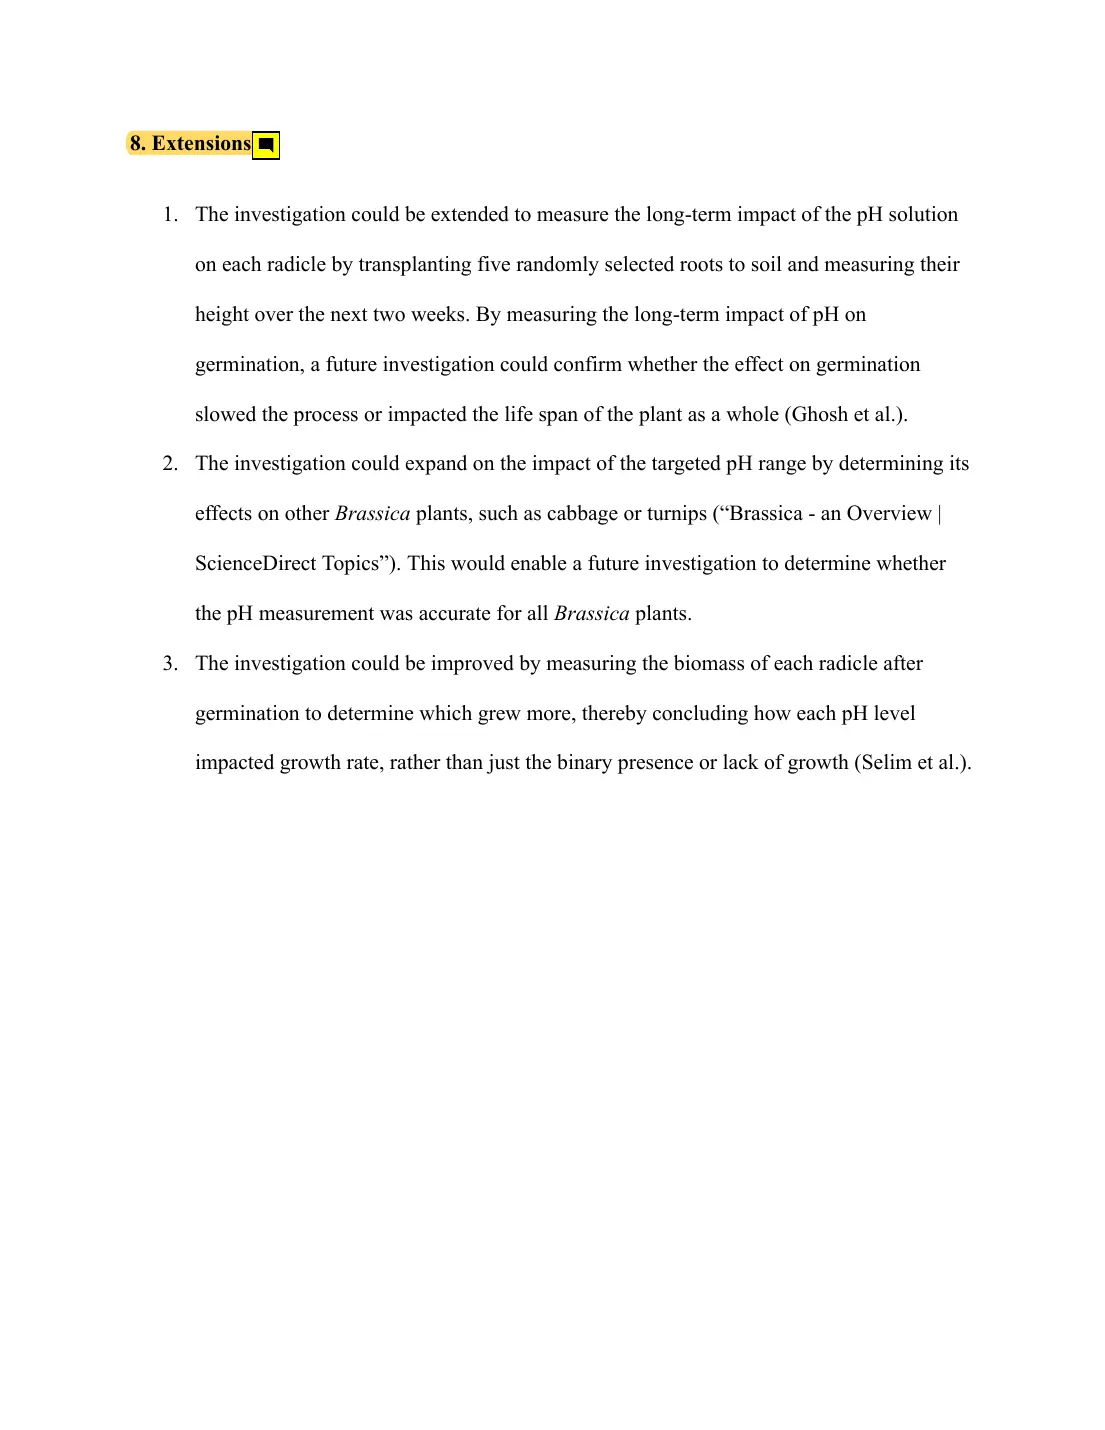
- Evaluation · second strand
Extensions are not improvements to this investigation.
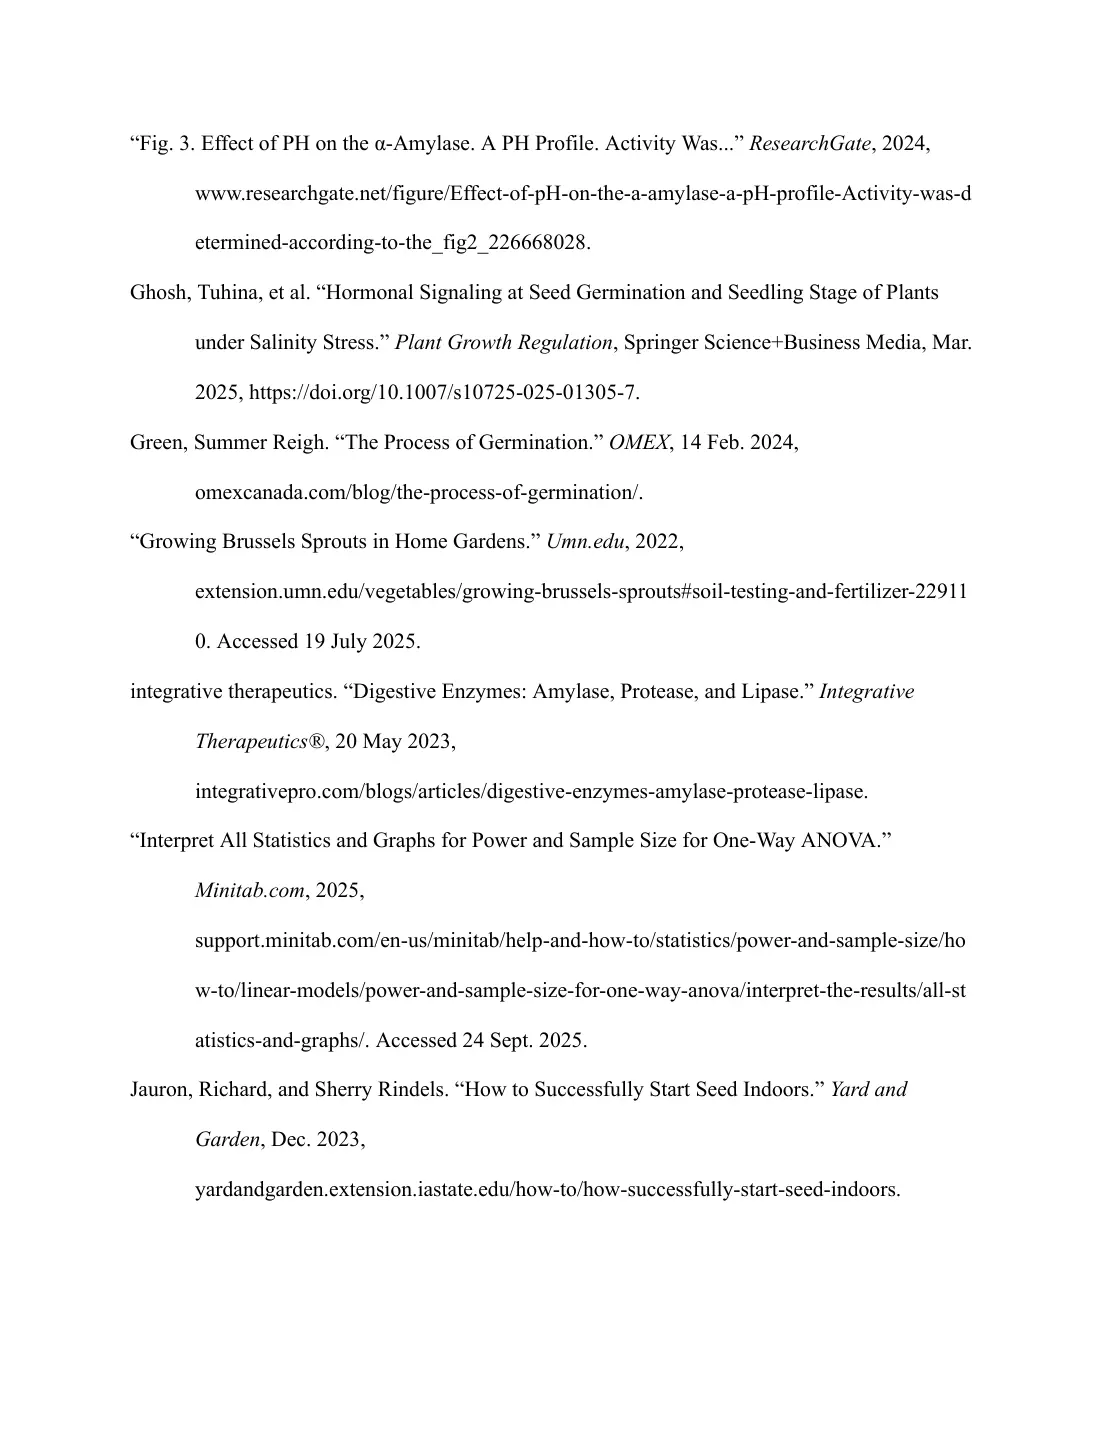
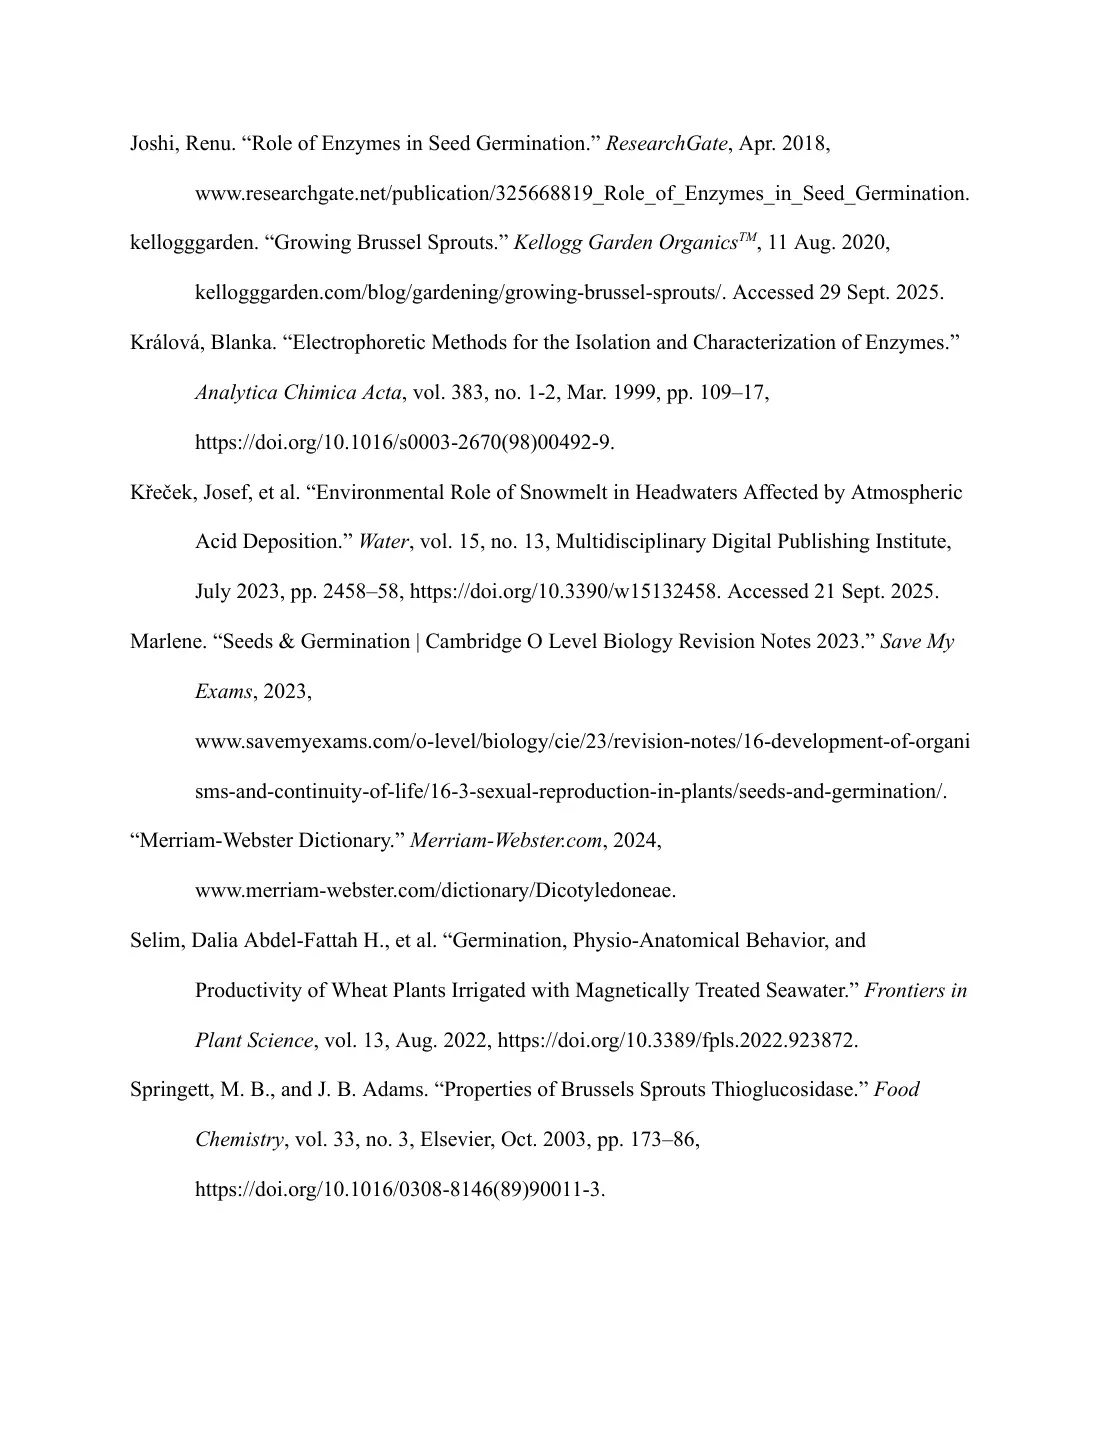
Pages 21 to 25: the references and appendix show
Page 21 of 25
Page 22 of 25
Page 23 of 25
Page 24 of 25
Page 25 of 25
Moderate one of yours
Your marks checked blind, the criterion comments written, and the script annotated like this one. Your first moderation is free.
Try it on a script →